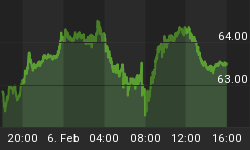
Gold is still looking good
The chatter last week was gold. The precious metal flew up $45 an ounce on Thursday, surprising investors, the media and markets alike.
If we look back just six months ago, gold was sitting at record lows, signaling that it was in extremely oversold territory. This was the time that many investors let fear take over and dismissed the fundamental reasons for owning gold: as a portfolio diversifier and store of value.
With the price spike, however, some of the perpetual gold naysayers suggested the metal had shifted to overbought status. Spot gold was up nearly 3 percent for the week, while gold stocks were up around 7 percent. So is gold overbought?
Some see gloom and doom. We see the bounce we said was coming. Based on our historical observations and the math of the markets, gold is not overbought, in our opinion, but is simply reverting to its mean. This mean reversion has shown that eventually, both gold stocks and gold bullion will move back to their historical averages.
Right now, as you can see from the chart below, gold stocks have seen a reversal to the long-term mean, but we are still waiting for gold bullion to do so as shown in the second chart.


There is always an emotional bias against gold, whether it is soaring high or dipping low, and that is why it's important to manage these emotions when positioning a portfolio. At U.S. Global Investors we look objectively at the action of both gold stocks and gold bullion by monitoring these long-term data points and paying attention to buy and sell signals based on the trend of mean reversion.
Additionally, I remind investors that moderation is key when it comes to gold. Your exposure should be 5 percent to gold stocks, 5 percent to gold bullion, while rebalancing annually.
Another reason that gold is moving is it's beginning its seasonal cycle, driven by cultural gold buying. The demand of gold reflected over the next several months and characterized by the purchase of the metal for cultural celebrations and religious holidays, I refer to as the Love Trade.
If you look at the chart below, you will see that July marks the beginning of the Love Trade with the celebration of Ramadan.

The Indian Festival of Lights comes after, followed by wedding season and, of course, Christmas.
This seasonal pattern is one of the most powerful drivers for gold demand. Monitoring this pattern, while remaining aware of other fundamentals to gold, such as mean reversion and a prudent 10-percent portfolio weighting (5 percent in gold stocks and 5 percent in gold bullion, while rebalancing annually), are imperative to understand when investing in gold. These trends allow us to manage short-term swings, small or large, that usually cause more concern than they are truly worth in the long term.
If you're curious to learn more about the trends in resources, I will be speaking July 22-25, at the Sprott Vancouver Natural Resource Symposium. You'll be able to take a front row seat to learn why experts in the field believe next year will be one of the most opportune times in history to invest in natural resources.
All opinions expressed and data provided are subject to change without notice. Some of these opinions may not be appropriate to every investor. By clicking the link above, you will be directed to a third-party website. U.S. Global Investors does not endorse all information supplied by this website and is not responsible for its content. Diversification does not protect an investor from market risks and does not assure a profit.
The NYSE Arca Gold BUGS (Basket of Unhedged Gold Stocks) Index (HUI) is a modified equal dollar weighted index of companies involved in gold mining. The HUI Index was designed to provide significant exposure to near term movements in gold prices by including companies that do not hedge their gold production beyond 1.5 years.


