


7/1/2014 8:56:27 AM
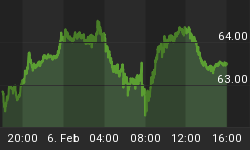
Another multi-year high for NASDAQ-100...
Recommendation: Take no action.
Click here to access our stock market chat rooms today! For a limited time, try our chat room for free. No subscription necessary to give it a try.
Stock Market Trends:

- ETF Positions indicated as Green are Long ETF positions and those indicated as Red are short positions.
- The State of the stock market is used to determine how you should trade. A trending market can ignore support and resistance levels and maintain its direction longer than most traders think it will.
- The BIAS is used to determine how aggressive or defensive you should be with an ETF position. If the BIAS is Bullish but the stock market is in a Trading state, you might enter a short trade to take advantage of a reversal off of resistance. The BIAS tells you to exit that ETF trade on "weaker" signals than you might otherwise trade on as the stock market is predisposed to move in the direction of BIAS.
- At Risk is generally neutral represented by "-". When it is "Bullish" or "Bearish" it warns of a potential change in the BIAS.
- The Moving Averages are noted as they are important signposts used by the Chartists community in determining the relative health of the markets.
Best ETFs to buy now (current positions):
Long DIA at $161.48 as of December 19, 2013
Long QQQ at $85.99 as of December 19, 2013
Long SPY at $181.19 as of December 19, 2013
Click here to learn more about my services and for our ETF Trend Trading.
Value Portfolio:
Long SDRL at $33.90 on June 15, 2012 (Shares were put to us when options expired. We were paid $1.10 per share when we sold those options and bought shares for $35.00 each.) We have collected dividends: June 10, 2014 $1.00, March 5, 2014 $0.98, December 3, 2013 $0.95, September 5, 2013 $0.91, June 5, 2013 $0.88, $1.70 Dec 4, 2012, $0.84 Sep 4, 2012. Total = $6.28 in dividend payments.
Short FXE at $124.19 on August 24, 2012
Long UUP at $22.43 on August 24, 2012
Short FXE at $134.48 on October 4, 2013
Long SDRL at $35.43 on Feb 18, 2014
Long SDRL at $33.50 on March 21, 2014 (Shares were put to us when options expired. We were paid $1.50 per share when we sold those options and bought the shares for $35.00 each.) We have collected dividends: June 10, 2014 $1.00.
We publish new reports to our free newsletter every month. If you're not a member, sign up by clicking here: Free Stock Market Newsletter
Equities opened lower but buying began almost immediately and prices moved higher for the first hour of trading. That was followed by a shallow sell-off that led to more buying and another sell-off, etc. By the close, the Dow and S&P-500 had traded in a narrow range and both recorded losses, although the S&P-500 was relatively flat and the Dow's loss was relatively modest. The NASDAQ-100, on the other hand, closed at a new multi-year high, for the second consecutive session. This left the Dow still closing below its 20-Day Moving Average (DMA). All other equity indexes we regularly monitor remain above their 20-, 50-, and 200-DMAs. Only the NASDAQ-100 maintained its uptrend state with all other equity indexes in trading states. The Semiconductor Index (SOX 635.92 +6.65) added more than one percent to lead the gainers. The Dow Jones Transport Index (IYT 147.01 +0.38), the Russell-2000 (IWM 118.81 +0.47), and the Bank Index (KBE 33.42 +0.06) posted fractional gains while the Regional Bank Index (KRE 40.32 -0.01) and the Finance Sector ETF (XLF 22.74 -0.02) closed relatively flat. All equity indexes remain with a BULLISH BIAS. Longer Term Bonds (TLT 113.23 -0.04) closed relatively flat and closed above its 20-, 50-, and 200-DMAs, has a NEUTRAL BIAS, and is in an uptrend state. Trading volume fell to a light 659M shares traded on the NYSE. Trading volume on the NASDAQ fell to average with 1.812B shares traded.
There were two economic reports of interest released:
• Chicago PMI (Jun) came in at 62.6 versus an expected 61.0
• Pending Home Sales (May) rose 6.1% versus an expected +1.5% rise
The reports were released fifteen to thirty minutes into the session.
Apple (AAPL 92.93 +0.95) added another one percent. It had been falling since a 7:1 stock split on June 8th but appears to be in rally mode now. AAPL constitutes about 20 percent of the NASDAQ-100 and nearly five percent of the S&P-500.
Seadrill Limited (SDRL 39.95 +0.52) added more than one percent as it moved definitively back up through its 200-DMA. The next target above remains $40.96, it's closing price on the last trading day of 2013. It is in an uptrend state. We sold March 2014 $35.00 put contracts for $150 at the open on Feb 18th, 2014 and bought shares at $35.43. The stock is now trading ex-dividend for $0.98 and one dollar for total dividends issued of $1.98. The stock fell back to just below its 200-DMA. The shares were put to us at $35.00 less the $1.50 per share we were paid for the puts, so we have an effective price of $33.50.
The U.S. dollar fell four tenths of one percent and is nearing its low of the year. The Euro rallied one third of one percent. The dollar continues to trade below its 200-DMA while the Euro closed just above its respective 200-DMA.
The yield for the 10-year treasuries fell one basis point to close at 2.52. The price of a barrel of crude oil fell thirty-seven cents to close at $105.37.
The implied volatility for the S&P-500 (VIX 11.57 +0.31) rose nearly three percent. The implied volatility for the NASDAQ-100 (VXN 12.21 +0.18) rose one percent. Both measures remain well below their respective 200-DMAs.
Market internals were bullish. Advancers led decliners 3:2 on the NYSE and by 4:3 on the NASDAQ. Up volume led down volume 5:4 on the NYSE and by 2:1 on the NASDAQ. The index put/call ratio rose +0.02 to close at 1.31 equity put/call ratio fell -0.02 to close at 0.50.
Conclusion/Commentary
The bulls were, for the most part, able to coax out gains on Monday, with the noted exceptions of the Dow, the S&P-500, the Finance Sector, and the Regional Banks. In other words, all the leading indexes posted gains. We look forward to renewed energy by equity bulls, even as we watch for a potential top in gold, gold miners (GDX 26.45 +0.47), and longer term bonds. We could get a liquidity fueled rally as funds that leave these other assets shift into equities markets. Gold miners, in particular, look to be setting up for a top and looks to be a good potential short, which we are eyeing. We will remain long equities until we see signs of a reversal.
We hope you have enjoyed this edition of the McMillan portfolio. You may send comments to mark@stockbarometer.com.


