


7/25/2014 8:51:53 AM
The Semiconductors plunge for the second day...
Recommendation: Take no action.
Click here to access our stock market chat rooms today! For a limited time, try our chat room for free. No subscription necessary to give it a try.
Stock Market Trends:

- ETF Positions indicated as Green are Long ETF positions and those indicated as Red are short positions.
- The State of the stock market is used to determine how you should trade. A trending market can ignore support and resistance levels and maintain its direction longer than most traders think it will.
- The BIAS is used to determine how aggressive or defensive you should be with an ETF position. If the BIAS is Bullish but the stock market is in a Trading state, you might enter a short trade to take advantage of a reversal off of resistance. The BIAS tells you to exit that ETF trade on "weaker" signals than you might otherwise trade on as the stock market is predisposed to move in the direction of BIAS.
- At Risk is generally neutral represented by "-". When it is "Bullish" or "Bearish" it warns of a potential change in the BIAS.
- The Moving Averages are noted as they are important signposts used by the Chartists community in determining the relative health of the markets.
Best ETFs to buy now (current positions):
Long DIA at $161.48 as of December 19, 2013
Long SPY at $181.19 as of December 19, 2013
Click here to learn more about my services and for our ETF Trend Trading.
Value Portfolio:
Long SDRL at $33.90 on June 15, 2012 (Shares were put to us when options expired. We were paid $1.10 per share when we sold those options and bought shares for $35.00 each.) We have collected dividends: June 10, 2014 $1.00, March 5, 2014 $0.98, December 3, 2013 $0.95, September 5, 2013 $0.91, June 5, 2013 $0.88, $1.70 Dec 4, 2012, $0.84 Sep 4, 2012. Total = $6.28 in dividend payments.
Short FXE at $124.19 on August 24, 2012
Long UUP at $22.43 on August 24, 2012
Short FXE at $134.48 on October 4, 2013
Long SDRL at $35.43 on Feb 18, 2014
Long SDRL at $33.50 on March 21, 2014 (Shares were put to us when options expired. We were paid $1.50 per share when we sold those options and bought the shares for $35.00 each.) We have collected dividends: June 10, 2014 $1.00.
We publish new reports to our free newsletter every month. If you're not a member, sign up by clicking here: Free Stock Market Newsletter
A modest gap up open proceeded to turn into a narrow trading range day on similar volume to that seen on Wednesday, i.e. light to average. The end result was a relatively flat close for the Dow and S&P-500 and a modest loss for the NASDAQ-100. Still, all three major indexes maintain their positions above their respective 20-, 50-, and 200-Day Moving Averages (DMAs), in trading states, with a BULLISH BIAS. The weakest performer of the day was the Semiconductor Index (SOX 629.13 -5.42) closed down near one percent. It closed below its 20-DMA. The Dow Jones Transports (IYT 151.40 -0.22) is the only equity indexes we regularly report on that is in an uptrend state. The Finance Sector ETF (XLF 23.02 +0.05) managed a modest gain. The three canaries were a mixed bag: the Russell-2000 (IWM 114.64 -0.23) posted a modest loss while the Bank Index (KBE 32.68 +0.33) added one percent and the Regional Bank Index (KRE 39.09 +0.47) added even more than that. This left the Russell-2000 and the Bank Index closing above their respective 200-DMAs while the Regional Bank Index closed just below its 200-DMA. All three closed below their 20- and 50-DMAs. All three maintain a BEARISH BIAS and all three are now in trading states. Longer Term Bonds (TLT 114.32 -0.86) posted a large fractional loss and shifted to a trading state. It maintains a BULLISH BIAS and remains above its 20-, 50-, and 200-DMAs. Trading volume increased modestly but remained light with 632M shares traded on the NYSE. Trading volume on the NASDAQ remained average with 1.885B shares traded.
In addition to the weekly natural gas inventory report, there were three economic reports of interest released:
• Initial Jobless Claims for last week came in at 284K versus an expected 308K
• Continuing Jobless Claims came in at 2.500M versus an expected 2.533M
• New Home Sales (Jun) came in at an annualized 406K versus an expected 475K
The first two reports were released an hour before the open while the last report came out a half hour into the session. The Initial Claims number is the lowest seen since before the financial crisis.
Apple (AAPL 97.03 -0.16) fell modestly. AAPL constitutes about 20 percent of the NASDAQ-100 and nearly five percent of the S&P-500.
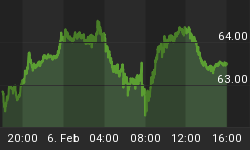
Seadrill Limited (SDRL 37.54 -0.51) fell more than one percent. Below, support lies at $37.41 while the next target above remains $40.96, it's closing price on the last trading day of 2013. It is in an trading state. We sold March 2014 $35.00 put contracts for $150 at the open on Feb 18th, 2014 and bought shares at $35.43. The stock is now trading ex-dividend for $0.98 and one dollar for total dividends issued of $1.98. The shares were put to us at $35.00 less the $1.50 per share we were paid for the puts, so we have an effective price of $33.50.
The U.S. dollar and the Euro were essentially unchanged with the dollar maintaining its position above its 200-DMA and the Euro below its 200-DMA.
The yield for the 10-year treasuries rose five basis points to close at 2.51. The price of a barrel of crude oil fell -$1.05 to close at $102.07.
The implied volatility for the S&P-500 (VIX 11.84 +0.32) rose most of three percent. The implied volatility for the NASDAQ-100 (VXN 13.08 +0.17) rose one percent.
Market internals were mixed. Decliners led advancers 9:8 on the NYSE and by 6:5 on the NASDAQ. Up volume led down volume 5:4 on both the NYSE and the NASDAQ. The index put/call ratio rose +0.60 to close at 1.58. The equity put/call ratio fell -0.01 to close at 0.58.
Conclusion/Commentary
We are starting to look like the bears may make another attempt at getting something started to the downside. It is premature to enter short trades, just yet and we will maintain our long positions in DIA and SPY for now. There are enough warning signs, at this time, that we do not advocate putting on any more long positions. Stay tuned.
We hope you have enjoyed this edition of the McMillan portfolio. You may send comments to mark@stockbarometer.com.


