


7/28/2014 9:05:38 AM
Bank Indexes put in modest rally...
Recommendation: Take no action.
Click here to access our stock market chat rooms today! For a limited time, try our chat room for free. No subscription necessary to give it a try.
Stock Market Trends:

- ETF Positions indicated as Green are Long ETF positions and those indicated as Red are short positions.
- The State of the stock market is used to determine how you should trade. A trending market can ignore support and resistance levels and maintain its direction longer than most traders think it will.
- The BIAS is used to determine how aggressive or defensive you should be with an ETF position. If the BIAS is Bullish but the stock market is in a Trading state, you might enter a short trade to take advantage of a reversal off of resistance. The BIAS tells you to exit that ETF trade on "weaker" signals than you might otherwise trade on as the stock market is predisposed to move in the direction of BIAS.
- At Risk is generally neutral represented by "-". When it is "Bullish" or "Bearish" it warns of a potential change in the BIAS.
- The Moving Averages are noted as they are important signposts used by the Chartists community in determining the relative health of the markets.
Best ETFs to buy now (current positions):
Long DIA at $161.48 as of December 19, 2013
Long SPY at $181.19 as of December 19, 2013
Click here to learn more about my services and for our ETF Trend Trading.
Value Portfolio:
Long SDRL at $33.90 on June 15, 2012 (Shares were put to us when options expired. We were paid $1.10 per share when we sold those options and bought shares for $35.00 each.) We have collected dividends: June 10, 2014 $1.00, March 5, 2014 $0.98, December 3, 2013 $0.95, September 5, 2013 $0.91, June 5, 2013 $0.88, $1.70 Dec 4, 2012, $0.84 Sep 4, 2012. Total = $6.28 in dividend payments.
Short FXE at $124.19 on August 24, 2012
Long UUP at $22.43 on August 24, 2012
Short FXE at $134.48 on October 4, 2013
Long SDRL at $35.43 on Feb 18, 2014
Long SDRL at $33.50 on March 21, 2014 (Shares were put to us when options expired. We were paid $1.50 per share when we sold those options and bought the shares for $35.00 each.) We have collected dividends: June 10, 2014 $1.00.
We publish new reports to our free newsletter every month. If you're not a member, sign up by clicking here: Free Stock Market Newsletter
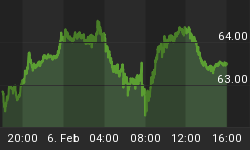
A gap down open was followed by a bit more selling on light trading volume to leave the Dow closing below its 20-Day Moving Average (DMA) but the NASDAQ-100 and S&P-500 closed above their respective 20-DMAs. All three closed above their 50- and 200-DMAs with fractional losses across the board. All three are in trading states, with a BULLISH BIAS. The weakest performer of the day was the Semiconductor Index (SOX 616.65 -12.48) which closed below its 20- and 50-DMAs. The Dow Jones Transports (IYT 150.77 -0.63) closed fractionally lower and is the only equity indexes we regularly report on that is in an uptrend state. The Finance Sector ETF (XLF 22.89 -0.13) closed fractionally lower. The three canaries were a mixed bag: the Russell-2000 (IWM 113.60 -1.04) lost nearly one percent while the Bank Index (KBE 32.71 +0.03) and the Regional Bank Index (KRE 39.12 +0.03) both added modest gains. This left the Russell-2000 closing even with its 200-DMA and the Bank Index closing even with its 50-DMA. All three closed below their 20-DMAs, with the Regional Bank Index and the Russell-2000 below their 50-DMAs. All three maintain a BEARISH BIAS and all three are now in trading states. Longer Term Bonds (TLT 115.67 +1.35) added more than one percent breaking out to a new closing high not since May of 2013. It shifted back into an uptrend state and maintains a BULLISH BIAS and is above its 20-, 50-, and 200-DMAs. Trading volume remained light with 527M shares traded on the NYSE. Trading volume on the NASDAQ fell to a light 1.684B shares traded.
There were two economic reports of interest released:
• Durable Goods Orders (Jun) rose 0.7% versus an expected 0.3% rise
• Durable Orders ex-transportation (Jun) rose 0.8% versus an expected 0.7% rise
Both reports were released an hour before the open.
Apple (AAPL 97.67 +0.64) moved counter to the broader market rising fractionally. AAPL constitutes about 20 percent of the NASDAQ-100 and nearly five percent of the S&P-500.
Seadrill Limited (SDRL 37.49 -0.05) fell modestly. Below, support lies at $37.41 while the next target above remains $40.96, it's closing price on the last trading day of 2013. It is in an trading state. We sold March 2014 $35.00 put contracts for $150 at the open on Feb 18th, 2014 and bought shares at $35.43. The stock is now trading ex-dividend for $0.98 and one dollar for total dividends issued of $1.98. The shares were put to us at $35.00 less the $1.50 per share we were paid for the puts, so we have an effective price of $33.50.
The U.S. dollar rose two tenths to a level not seen since February. The Euro fell two tenths of one percent closing at a level not seen since early November last year. The dollar broke out above the 200-DMA early in the week and continued to rise modestly each day since. The Euro broke below its 200-DMA in May, and, other than a single day in June, has been unable to move back above that important level. It appears that the longer term trend may be changing.
The yield for the 10-year treasuries fell four basis points to close at 2.47. The price of a barrel of crude oil closed flat (up two cents) to close at $102.09.
The implied volatility for the S&P-500 (VIX 12.69 +0.85) soared seven percent. The implied volatility for the NASDAQ-100 (VXN 13.36 +0.28) rose two percent.
Market internals were bearish. Decliners led advancers 2:1 on both the NYSE and the NASDAQ. Down volume led up volume 2:1 on the NYSE and by nearly that ratio on the NASDAQ. The index put/call ratio fell -0.09 to close at 1.49. The equity put/call ratio rose +0.04 to close at 0.62.
Conclusion/Commentary
We saw a day of weakness which may prove to be the pause that refreshes. For now, we will maintain our long positions but not add to them. We are anxious to see if the bank indexes can continue to show recent strength. Stay tuned.
We hope you have enjoyed this edition of the McMillan portfolio. You may send comments to mark@stockbarometer.com.


