


Graceland Updates 4am-7am
Aug 19, 2014
- In any market, but especially precious metals, price pullbacks rarely proceed according to expectations.
- Most "buying opportunities" are perhaps better defined as gulags and torture chambers. Regardless, it's almost impossible to build retained wealth without enduring a significant amount of pain, so please click here now .
- That's the weekly CRB general commodity index chart. I've suggested that 2014 is a key year of transition, away from system risk and deflation, towards some growth and lots of inflation.
- Lead by gold, the CRB began the year with a strong rally, as the Fed began to taper its QE program. The rally lost momentum in March, and a decline began in June.
- The 284 - 287 area is a key Fibonacci and HSR (horizontal support and resistance) zone. Note the position of the 14,3,3 Stochastics indicator, aka the "weekly chart stoker". Downside momentum appears to be waning, and gold has outperformed most commodities during the decline.
- The next intermediate trend movement for the CRB index, and for gold, should be to the upside.
- On that note, please click here now . At about 2PM on Wednesday, the next FOMC minutes get released, and key US housing start numbers will be reported today. The bottom line: With the CRB index approaching solid support, any gold-negative news is not likely to move the price of gold lower than $1275.
- The upside numbers of importance are $1325, $1347, and $1392. This is a different market than it was, when QE was the main theme of global gold price discovery. While it will likely take much longer than most investors expect for gold to rise significantly, it will still rise, and gold and silver equities are poised to do extremely well.
- A lot of gold analysts believe that the Dow is poised to collapse, and when it does the Fed will bring back its QE program, causing the price of gold to soar.
- Unfortunately, I think they are dead wrong. The Dow is certainly overdue for a significant sell-off, but most value investors are on the sidelines now (including myself), and they would likely buy any decline of size. As the economy builds momentum, factory capacity utilization continues to grow, creating inflation.
- The money created by QE is likely to make higher inflation appear faster than a normal economic upswing would, and many institutional money managers would be likely to buy gold stocks rather than gold, as that happens. Gold is bought when system risk is perceived to be the main theme in play. Gold equities are bought when strong growth, and inflation created by that growth, are in play.
- In a worst case scenario, where the economic recovery suddenly stalls and reverses, I would emphatically argue that the Fed might engage in a one-time stimulus, but a return of QE is highly unlikely.
- A return to QE would make the Fed look weak, which it isn't.
- Instead, a "gold band" would likely be the next tool the Fed brings out of its tool box, if the economy crashed.
- A gold price band is simply a watered down form of gold revaluation. In an emergency situation, the Fed could be authorised by the US Treasury to quickly establish a moderately higher trading band for gold, likely between $1500 and $1800 area. That would be phenomenal news for gold and silver equity investors, but perhaps not such good news for anyone caught holding giant leveraged short positions on the COMEX.
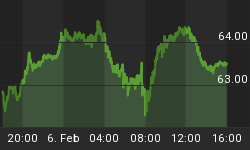
- Please click here now . That's the GDXJ daily chart. Over the past month, most commodities have suffered nasty declines, while junior gold stocks have shown tremendous resilience. Note the nice green up channel that is now in play.
- Copper is in the news, and according to some mainstream media it is declining, and that's "bearish" for commodities. Please click here now . The commercial traders are now slightly net long copper. Please click here now . This daily copper chart suggests there is little cause for concern about deflation. Note the bullish posture of my stoker oscillator, at the bottom of the chart!
- The Western gold community is likely on solid footing in 2014 - 2015, regardless of whether the economy grows and creates inflation, or whether it suffers a black swan crash event. The weight of the evidence suggests that strong economic growth, and even stronger inflation, is what lies ahead over the next twelve months.
- While a number of lightweight analysts and mainstream media analysts have spent the past week comparing Chindian gold demand to the demand during the spring of 2013, heavyweight bank economists are focused on the overall bullish trend in play. Physical gold demand must be compared to a multi-year trend, not simply to QE-oriented selling of ETF holdings that occurred during the spring of 2013.
- Please click here now . As this snapshot of SPDR holdings shows, once again Western investors have bought price weakness. Over the past week, SPDR holdings increased nicely, from the 795 tons area, to about 797. The new breed of SPDR investor is not QE-oriented. They're likely inflation-oriented, and certainly strong-hand buyers of price weakness.
- Globally, there is a tremendous fundamental floor for gold. Please click here now . Thailand is a significant source of gold demand, and the top bullion dealers there are working on a spot exchange that could rival or even surpass the Singapore market.
- China is also "on the move" in the gold world. Please click here now . This snapshot, courtesy of The Economic Times, shows China adding 3 more gold importers to its roster, with the goal of bolstering its role in global gold price discovery.
- Please click here now . This chart compares the US dollar to the Indian rupee. There's a bearish wedge in play for the dollar, and the central bank is generally quite happy with the current trading range.
- With interest rates at 8%, the Indian central bank is likely to embark on a modest rate cutting cycle in 2015 -2016, while the Fed gently tightens, in response to growing concerns about inflation. That could cause enormous amounts of capital to flow into Indian equity markets, and out of US stock and bond markets. Gold benefits tremendously, from these twin price drivers. As an asset, gold feels spectacularly strong in its year of transition, and it's getting stronger.... every day!
Special Offer For Website Readers: Please send me an Email to freereports4@gracelandupdates.com and I'll send you my free "silver hyper trader" report. I'll show you how to place silver trades with stop losses, on the 60 minute chart, to maximize reward and minimize risk!
Thanks!
Cheers
St


