• 857 days Will The ECB Continue To Hike Rates?
  • 858 days Forbes: Aramco Remains Largest Company In The Middle East
  • 859 days Caltech Scientists Succesfully Beam Back Solar Power From Space
  • 1,259 days Could Crypto Overtake Traditional Investment?
  • 1,264 days Americans Still Quitting Jobs At Record Pace
  • 1,266 days FinTech Startups Tapping VC Money for ‘Immigrant Banking’
  • 1,269 days Is The Dollar Too Strong?
  • 1,269 days Big Tech Disappoints Investors on Earnings Calls
  • 1,270 days Fear And Celebration On Twitter as Musk Takes The Reins
  • 1,272 days China Is Quietly Trying To Distance Itself From Russia
  • 1,272 days Tech and Internet Giants’ Earnings In Focus After Netflix’s Stinker
  • 1,276 days Crypto Investors Won Big In 2021
  • 1,276 days The ‘Metaverse’ Economy Could be Worth $13 Trillion By 2030
  • 1,277 days Food Prices Are Skyrocketing As Putin’s War Persists
  • 1,279 days Pentagon Resignations Illustrate Our ‘Commercial’ Defense Dilemma
  • 1,280 days US Banks Shrug off Nearly $15 Billion In Russian Write-Offs
  • 1,283 days Cannabis Stocks in Holding Pattern Despite Positive Momentum
  • 1,284 days Is Musk A Bastion Of Free Speech Or Will His Absolutist Stance Backfire?
  • 1,284 days Two ETFs That Could Hedge Against Extreme Market Volatility
  • 1,286 days Are NFTs About To Take Over Gaming?
  1. Home
  2. Markets
  3. Other

SP500 and 10 Year US Notes Elliott Wave Analysis

10 year US notes are on the move and looks like we can see even more gains as yield is trying to go beneath 2%. However before continuation higher on 10 year Notes can restart we may see a retracement back to 128'00 area where we see a rising support line.

10 year US notes 4h Elliott Wave Analysis

10 year US notes 4-Hour Elliott Wave Analysis Chart

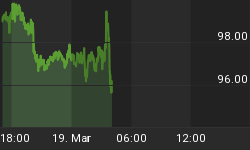
The US markets will open in around 10mins and it seems like price want to rally at the start of the session while the 10 year T-note is moving slightly lower at the moment, away from yesterday highs. As such, the E-mini S&P500 can still be forming a corrective wave 4) with wave C yet to come up to 1870/1875 area before downtrend resumes into wave 5).

S&P500 (Dec 2014) 1h Elliott Wave Analysis

S&P500 (Dec 2014) 1-Hour Elliott Wave Analysis Chart


Subscribe Our Newsletter If you already haven't >> http://goo.gl/8QVevl


Back to homepage

Leave a comment

Leave a comment