


Woe unto the gold speculators, and a curse laid upon the house of silver.
At least, that's how it may feel. In more clinical terms, the gold price fell from $1,230.90 to $1,172.59, or $58.31. The drop this week was 4.7%. The price closed the week below the level set after the crash of 2013, which was $1180 (by the way, an intraday dip). The gold price has never closed a day below $1188 since 2010.
The silver price fell from $17.17 to $16.13. $1.04 is 6.1%. It's never been lower in years, except briefly in 2010.
On April 9, we said:
"The neutral price of silver is in the $16's today. If the price overshoots as far to the downside as it is now stretched to the upside, we could see silver with a 12 handle."
We got hate mail.
In the first place, one would hope that people don't shoot at messengers. We are of the firm belief that gold and silver are money, and the paper issued by the Fed is not. At the same time, we argue that this view is not a trading strategy. For trading, we look to market data.
Second, we were right. While other analysts called every blip with renewed forecasts of $50 and $250, the silver price has spoken. It had a false breakout in June, and has been falling steadily since then. It has traded with a 15 handle this week. Incredibly, the fundamental price we calculate for silver is still below the market price.
To see the fundamentals, read on...
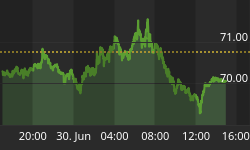
First, here is the graph of the metals' prices.
The Prices of Gold and Silver
We are interested in the changing equilibrium created when some market participants are accumulating hoards and others are dishoarding. Of course, what makes it exciting is that speculators can (temporarily) exaggerate or fight against the trend. The speculators are often acting on rumors, technical analysis, or partial data about flows into or out of one corner of the market. That kind of information can't tell them whether the globe, on net, is hoarding or dishoarding.
One could point out that gold does not, on net, go into or out of anything. Yes, that is true. But it can come out of hoards and into carry trades. That is what we study. The gold basis tells us about this dynamic.
Conventional techniques for analyzing supply and demand are inapplicable to gold and silver, because the monetary metals have such high inventories. In normal commodities, inventories divided by annual production can be measured in months. The world just does not keep much inventory in wheat or oil.
With gold and silver, stocks to flows is measured in decades. Every ounce of those massive stockpiles is potential supply. Everyone on the planet is potential demand. At the right price, and under the right conditions. Looking at incremental changes in mine output or electronic manufacturing is not helpful to predict the future prices of the metals. For an introduction and guide to our concepts and theory, click here.
Next, this is a graph of the gold price measured in silver, otherwise known as the gold to silver ratio. It rose a full point, or 1.4%. Our original call back in 2013 (when the ratio was around 52, and most analysts were calling for it to fall) was 60 and maybe 70. We later updated that to 70 and maybe higher. Most recently, we updated it to 75 and maybe 80. Early Friday morning, the ratio hit 73.96.
The Ratio of the Gold Price to the Silver Price
For each metal, we will look at a graph of the basis and cobasis overlaid with the price of the dollar in terms of the respective metal. It will make it easier to provide terse commentary. The dollar will be represented in green, the basis in blue and cobasis in red.
Here is the gold graph.
The Gold Basis and Cobasis and the Dollar Price
Look at that run up in the dollar. It's impressive!
As recently as Oct 20, the price of the dollar was under 25mg gold. Now it's over 26.5mg.
Along with this rise in the dollar price (which most people think of as the fall in the gold price), has been a rise in the scarcity of gold. We now have a substantial positive cobasis -- i.e. backwardation -- in gold.
We calculate a fundamental price of gold some $48 over the market price. This does not mean that the price couldn't drop further, but it does tend to apply an upward pressure to prices.
Now let's look at silver.
The Silver Basis and Cobasis and the Dollar Price
The dollar rose even more sharply in silver. It was 1.81g silver at the end of last week, and now 1.93g. In July, it was 1.45g.
The cobasis is up sharply, and December silver is now also quite backwardated. There are some key differences between silver and gold, which we shall not elaborate here. Thus we calculate the fundamental price in silver at $0.77 below the market price.
In most of the little price moves in the past few years -- do we dare assume it's the new normal? -- the cobasis (scarcity) has moved proportionally with the dollar price (opposite of the metal price, measured in dollars). In other words, at lower prices the metal becomes scarcer and at higher prices it becomes more abundant.
This week, the metal became a little scarcer but the price fell more than a little. Don't be fooled that the price drop was caused by high frequency trading, low integrity manipulation, or zero clothing shorting of futures. It was caused by selling of futures and, just as importantly, physical metal.


