• 749 days Will The ECB Continue To Hike Rates?
  • 749 days Forbes: Aramco Remains Largest Company In The Middle East
  • 751 days Caltech Scientists Succesfully Beam Back Solar Power From Space
  • 1,151 days Could Crypto Overtake Traditional Investment?
  • 1,155 days Americans Still Quitting Jobs At Record Pace
  • 1,157 days FinTech Startups Tapping VC Money for ‘Immigrant Banking’
  • 1,160 days Is The Dollar Too Strong?
  • 1,161 days Big Tech Disappoints Investors on Earnings Calls
  • 1,162 days Fear And Celebration On Twitter as Musk Takes The Reins
  • 1,163 days China Is Quietly Trying To Distance Itself From Russia
  • 1,164 days Tech and Internet Giants’ Earnings In Focus After Netflix’s Stinker
  • 1,167 days Crypto Investors Won Big In 2021
  • 1,168 days The ‘Metaverse’ Economy Could be Worth $13 Trillion By 2030
  • 1,169 days Food Prices Are Skyrocketing As Putin’s War Persists
  • 1,171 days Pentagon Resignations Illustrate Our ‘Commercial’ Defense Dilemma
  • 1,171 days US Banks Shrug off Nearly $15 Billion In Russian Write-Offs
  • 1,174 days Cannabis Stocks in Holding Pattern Despite Positive Momentum
  • 1,175 days Is Musk A Bastion Of Free Speech Or Will His Absolutist Stance Backfire?
  • 1,175 days Two ETFs That Could Hedge Against Extreme Market Volatility
  • 1,177 days Are NFTs About To Take Over Gaming?
What's Behind The Global EV Sales Slowdown?

What's Behind The Global EV Sales Slowdown?

An economic slowdown in many…

Is The Bull Market On Its Last Legs?

Is The Bull Market On Its Last Legs?

This aging bull market may…

  1. Home
  2. Markets
  3. Other

GOLD and OIL Intraday Elliott Wave Analysis

Crude oil is turning down sharply down after making a new high that has been expected for a completed five wave cycle in wave c. Further weakness through 75.62 will be bearish for crude that could then revisit 73.25 lows next week.

CRUDE OIL (January 2015) 1h Elliott Wave Analysis

CRUDE OIL (January 2015) 1-Hour Elliott Wave Analysis Chart

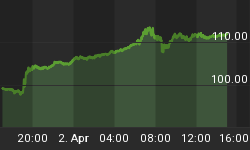
GOLD is at the highs following the pattern from start of November when metals broke higher each Friday. Well, we see price at the highs, but this time rally can be different and much smaller as we see prices in wave (v), final leg of a larger five wave recovery. In fact, we see breakout from a triangle, so it's the final trust, therefore upside can be limited around 1210-1215.

GOLD 1h Elliott Wave Analysis

GOLD 1-Hour Elliott Wave Analysis Chart


Subscribe Our Newsletter If you already haven't >> http://goo.gl/8QVevl


Back to homepage

Leave a comment

Leave a comment