


The following is part of Pivotal Events that was published for our subscribers December 4, 2014.
Signs of The Times
"Even in the $100 trillion market for bonds worldwide, one of the most persistent dilemmas facing potential buyers is a dearth of supply. Demand for debt has surpassed issues five times in the past seven years. The shortfall is set to continue into 2015."
- Bloomberg, November 24.
"Leveraged loan issuance plummeted in the U.S. this month--slowest November since 2008."
- Bloomberg, November 26.
One of the features about the bond market is that on the bigger moves is that it is global and it can turn in an instant. Bids one day, none the next.
The following on China will take a very long time to resolve and it reminds of Vanderbilt's comments on overbuilding anything.
"These worthless roads prejudice the commercial credit of our country abroad. Building railroads from nowhere to nowhere at public expense is not a legitimate undertaking."
That was uttered during the crash of the 1873 Bubble.
"'Ghost cities' lined with empty apartment blocks, abandoned highways and mothballed steel mills sprawl across China's landscape...the outcome of government stimulus. This has generated $6.8 trillion in wasted investment since 2009."
- Financial Times, November 28.
And then there are the passions of the global warmers:
"Germany's Environment Minister Calls on Citizens to Turn Off Lights During Sex"
- ClimateDepot, November 28.
One of the rewards of spending years in the library stacks is the discovery of an instructive amusement. One was from the early 1600s when a writer in the earliest form of a newspaper in Newcastle was extolling the wonders of burning coal in the fire place. Particularly in the bedroom where the warmth and light "heightened the joys of intimacy".
Perspective
For decades we have been hammering the issue of inflation in financial assets and that policymakers, even the most recent generation, still don't get it. Well it is complex out there. Most commodities have been chronically weak, the basic cost of living continues to rise. Commodity and precious metal perma-bulls have been disappointed. The truth of the matter, is that the public chooses where the action will be and how long it will last.
Then with exquisite irony "can never accommodate" its own desires.
In the 1970s the action was in commodities, wages and components that made up the CPI. Since 1982 the main action has been in financial assets. Within this there have been outstanding bull moves in precious metals and crude oil.
Whatever has been going on, the behaviour of policymakers has remained the same.
Intruders must intervene. For any circumstance the recipe has been accommodation or credit ease. In so many words, depreciation under the school of inflationism.
The Austrian School had a good handle on it and von Mises summed it up with:
"Inflationism, however, is not an isolated phenomenon. It is only one piece in the total framework of politico-economic and socio-philosophical ideas of our time. Just as the sound money policy of gold standard advocates went hand in hand with liberalism, free trade, capitalism, and peace, so is inflationism part and parcel of imperialism, militarism, protectionism and socialism."
Back in the 1970s when CPI "inflation" was a monster one saying was that "the only cure for high prices is higher prices". Over time, that has worked in tangible assets and will it work for inflation in financial assets?
It worked in 2000 when massive issuance of tech stocks satisfied unusually impetuous demand.
It worked in 2007 when massive issues of fabricated securities such as sub-prime loans satisfied demand.
When will this year's issuance of "paper" satisfy demand?
For lower-grade corporate bonds that seems to have been reached in June. October's low in price is being tested now and breaking through will confirm that deflation in this important sector is becoming serious.
New issues of equities have surged since the low of only 31 in 2008 to 222 in 2013 and to December this year the number, according to Renaissance Capital, is 261. In 2006 the number was 196 and in 2007 it was 213.
Underwriters are doing an outstanding effort to meet equity demands.
Stock Markets
From the Springboard Buy on the S&P registered in the middle of October, the index has been on an unusually powerful rally (actually unseen in the S&P on data back to 1928).
The preceding correction drove the Daily RSI down to 29 on October 16th. This is the level that held setbacks over the past 18 months. Then, the zoom took the RSI to 74 last week. That is a rapid swing that needs correction.
So what's ahead, seasonally?
Ross is updating the "Turn-Of-The Year" model. Small caps would be expected to outperform big caps from the middle of this month to early January.
The European STOXX set its high for the year in June and its decline led the "correction" in the S&P. Europe as a leading indicator has a long record.
Along with London, the great bull markets peaked in June. The dates are:
1720, 1772, 1825, 1873 and 1929. On the last two, New York peaked in September.
Picking up the pattern, we have the STOXX chart back to 1998 and the peak was set in early March with New York's Tech Bubble. That failure began in June.
In 2007 the peak was set in the middle of June, leading that in NY by four months.
This time around, Europe peaked in the middle of June at 3325, which was tested at 3301 in September. The decline was 18% to 2789 and the rally has made it to 3238 and is resting this week. This sets three declining peaks with three Daily RSIs at serial lows.
Robust convictions have been weakening.
The most obvious threat to Europe is widening of credit spreads with Russian bonds leading the way.
In New York, the composite (NYA) set its momentum high in June and the index high at 11108 in early September. The low was 9886, you know when, and the rebound made it to 11068 a couple of weeks ago. That high is being tested now. The key test rally was accomplished with a lower Daily RSI.
Beyond Europe's vulnerability to widening spreads, the chart of US corporate spread widening has reached new highs for the move.
The excesses of the late summer precipitated a tradable correction for the S&P. The trade was larger in other sectors such as the RUT and STOXX.
Excesses are back and becoming impressive.
Credit Markets
A special update on credit markets was sent out on Monday. Sometimes it is worth emphasizing an opportunity and that was the setback in high-grades and junk, both on the same day. JNK and HYG have since set closes a bit below the lowest closes of October.
Along with this, spreads between Baa and treasuries have continued to widen. The chart follows showing another breakout. The worst in October was a spread of 171 bps and it is now at 184 bps, a new 'wide' for the year.
Russian yields from one-year to the ten-year are soaring. The one-year is already at the level reached at the worst of the 2008 Panic and the ten-year is almost there. Chronically weak commodities and a plunging crude price reminds of 2008 and of 1998. The latter saw the beginning of the LTCM collapse that started in that fateful May. Russia joined the collapse in that fateful August. Credit pressures became universal and the panic exhausted itself in the equally fateful October.
So far, this panic has moved from page 17 to page 6 of any financial newspaper.
We have been looking for the bond future to test the high of 147.75 reached in October.
Seasonals are favourable into the end of the year.
Commodities
Grains (GKX) continue to act well. Last week, becoming impressed by weakness in other commodities we thought that if it did not break above 327 it would take a rest. Well it reached 329.28 on Tuesday which is constructive.
Base metals (GYX) could be working on support. We have been using copper's seasonal weakness to find a low in or close to November. The index set a low of 339 in the middle of October and bounced to 359 last week. Monday's intra-day low was 340 and today's high has been 348.
Another "Rotation" like last year's has been possible with a rally into the first quarter.
For crude oil the target has been for a seasonal low in December. Outside of that our outlook has been for a transition to a lower-price regime, similar to the one that drove natural gas prices down. Our other point has been that a significantly lower price would impair the ambitions of Putin as well as Middle East terrorists.
Indeed, a sharp reduction in revenues to all ambitious governments could lead to another movement to political reform.
As refreshing as that would be, crude is in a classic crash and while very oversold the action is not yet working on a Sequential Buy. Previous crashes have run for 6 to 7 months, so this metric counts out to around January. That is to say, sometime over the next 6 or 7 weeks.
Following previous crashes, it has taken a couple of months to set and test the bottom.
Oil stocks (XLE) waved huge technical flags at the peak in June at 101. The low in October was 77.52 and the bounce made it to 89.21 a couple of weeks ago. Monday's low was 78.67 and it popped to 82.61 yesterday. As with crude, the Oil Patch could take some time to set the bottom.
Precious Metals
We have been looking for gold shares divided by gold (HUI/GLD) to bottom and stabilize before making major commitments to gold stocks. This is working out as the ratio plunged to its lowest since late 2000. The Weekly RSI was as oversold as then, but not to the level plumbed in late 2008.
The low was at .128 in early November and the bounce made it to .153. The next low was at .137 last week. This has been following the 50-Day ma down. Breaking above would be very constructive.
It is oversold at a level we think that ends the bear market for the sector. The key is entry and nimble traders have been at work, investors can begin to buy on the next dip in the stocks.
That is our way of reviewing the opportunities in the overall post-bubble environment, of which the first boom and bull market are getting mature. The gold industry does very well when the costs of mining are declining relative to the bullion price.
And then, there is a more immediate opportunity.
The Dollar Index is overbought enough to force a tradable correction and this will pop the precious metals sector. This would require silver rallying relative to gold.
Good for traders now and good for investors over the long haul.
Credit Spreads

- Spreads continue to widen.
- Now becoming a methodical uptrend.
- It is at a "wide" for the year.
Panic!
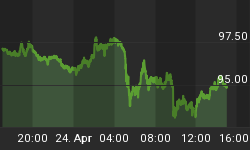
Russian Ten-Year Yield

- Since the brief decline to November 24th, the yield has soared from 10.15% to 11.20%.
- This is at the level set in October 2008. The ultimate high was 12.79%, set on February 28, 2009.
- The one-year note has soared from 5.46% in November 2013 to 10.71% now.
- The high in the 2008 Crash was 10.71%.
- Since its extreme low of 0.69% set at the end of November, the German yield has jumped to 0.77%.
Link to December 5 Bob Hoye interview on TalkDigitalNetwork.com: http://talkdigitalnetwork.com/2014/12/crude-expected-to-hit-low-in-6-to-8-weeks


