


The bull that began in March 2009 is on track to celebrate its sixth birthday early in 2015. As shown in the graph below, S&P 500 closed 2014 near its record high. The index hit records in more than 50 sessions throughout the year and ended its third straight year of double-digit percentage gains. The benchmark added 11.4 percent this year. The Dow Jones industrial average gained 7.5 percent including 38 all-time highs, and the Nasdaq Composite gained 13.4 percent for the year. U.S. stocks posting a third straight year of 10%-plus gains is the first time it has scored a performance hat trick of that magnitude since the last great bull market in the late 1990s. The graph below confirms U.S. government debt that matures in 20 years and beyond booked a 27 percent return. That is its biggest annual gain since 2011, when it generated a 33 percent return. All of this happened during a year in which interest rates were almost unanimously expected to rise.

Last week we said "......The updated Bullish Percent Index chart below confirmed the recent uptrend move, but the trend is probably converting into sideways action because prices should consolidate going into year-end....." As noted below, the updated chart below affirms our previous analysis because prices have converted to a flat trend with neutral momentum.

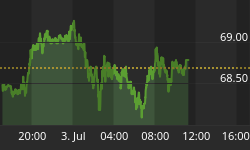
The stock market cooled off last week as traders vacationed during the holiday week. As seen in the graph below, Treasury bonds rose last week when investors parked funds in treasures for safekeeping while they were out on break. Plus signs that interest rates will remain low for the foreseeable future contributed to the upward surge in treasuries and the dollar.

Market Outlook
The Santa Claus rally officially ends on Monday. Technically, all the major indexes are down during the Santa Claus rally which began the day before Christmas. Normally, during this week the S&P 500 posts an average gain of 1.5%. The failure of stocks to rally during this time tends to precede bear markets or times when stocks could be purchased at lower prices later in the year. But, some pundits claim the Santa Claus rally actually began a week earlier than normal when the Dow Jones Industrial Average gained more than 700 points in three days and the S&P 500 Index rallied 5%.
Since 1929, January has been one of the seasonally strongest months for the S&P 500, with average and median price returns of +1.3%/+1.6% vs. average/median returns of +0.6%/+0.9% for all months. January has also had the second highest percentage of positive returns (64%) after December (75%). Returns have tended to be even stronger following years where the S&P 500 has double-digit gains, as it was last year. In these years, returns have averaged +1.8%, with positive returns 68% of the time.
Last week's comment is still valid "......As the fourth quarter winds to an end, the chart below shows that Real Estate remains the top performing asset class. But other sectors that are coming on strong such as the small cap Russell 2000 and DOW Transports signal that investors are confident about future economic performance. Particularly the Russell 2000 is considered a bellwether for near term direction on where the market is headed......"

Last week we observed how "......prices are consolidating at recent highs. Also note that momentum indicators are neutral which suggest near term range-bound trading until prices break higher or lower......" This observation proved accurate, in the updated Momentum Factor ETF (MTUM) chart below we highlight where the price broke lower to start a new downtrend and momentum is turning bearish.

In the updated Volatility Index (VIX) chart below, you can see the index surged higher to end the year while the S&P 500 index retrenched. Investors did a lot of portfolio rebalancing and tax related selling which halted upward stock market momentum. For the first trading day of 2015, the VIX pulled back as the equity market stabilized.

The VIX surge discussed above is reflected in the data below. The excessively high Put/Call ratio numbers derive from investors buying puts at the end of the year to protect gains on long positions.

As we have been saying recently "......the best bet is still moderate price movement over the next week or so with prices spurting higher into year-end...As a contrarian indicator, the current reading supports the analysis that price consolidation is due and possibly a price pullback......" This analysis is playing out as advertised. As a contra indicator, the current American Association of Individual Investor Survey (AAII) survey result has gotten excessively bullish while the stock market stalls.

The National Association of Active Investment Managers (NAAIM) Exposure Index represents the average exposure to US Equity markets reported by association members. The green line shows the close of the S&P 500 Total Return Index on the survey date. The purple line depicts a two-week moving average of the NAAIM managers' responses. As the name indicates, the NAAIM Exposure Index provides insight into the actual adjustments active risk managers have made to client accounts over the past two weeks. Fourth-quarter NAAIM exposure index averaged 60.86. Last week the NAAIM exposure index was 90.59%, and the current week's exposure is 95.86%. Money managers significantly increased their equity exposure for year-end window dressing. These investors are getting close to being fully invested as they were at this time last year. Similar to last year, expect money managers to pull back on their equity exposure over the next few weeks. They will need to have some funds available when corporate earnings season arrives.


Trading Strategy
Our recent observation is still valid "......The equity market appears to be reaching a summit as it has crawled to new highs on relatively light volume during the end of year holiday season...Utilities are far and away the best performing sector over the past month. This suggests that investors are taking a 'risk off' trading approach, as utility stocks generally are considered safe, stable and maintain value compared to other shares during market fluctuations. A standard year-end trading strategy is to sell off underperformers and shares that have attained their profit target...it is good strategy to have a large cash positon going into the New Year to have the option of bidding on stocks that have high profit potential......"
Notice that leading sectors a few months ago are now lagging, such as Technology, Consumer Staples, and Healthcare. Also, after crashing over the past month or so the Energy sector is no longer the biggest loser and appears to have found a bottom. There should be opportunities to do short term option trades on energy stocks and some readers are aware that a few weeks ago we published a very profitable Energy ETF trade. The Technology sector also may be oversold and now might be an opportune time to scan for high momentum tech stocks that can generate a quick profit. Bidding on Cyclical and Industrial stocks could be a good move because those sectors are popular this time of year as the U.S. economy is strengthening.

Feel free to contact me with questions,


