


Today's column is a brief one, as I need to post a correction. Not a correction to my stuff, mind you, but to others.
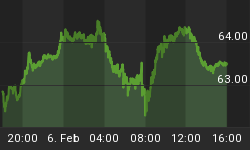
Pictures like the below have been circulating now for a couple of weeks. This is a chart of the 2-year inflation "breakeven" on Bloomberg, illustrating how a "deflation warning" is sounding as they go negative.

Unfortunately, it ain't so. I wrote to the authors of the original Bloomberg piece referenced above, and called Bloomberg (more on that later), and figured that when I pointed out that 2-year inflation expectations are nowhere near zero, the story would at least die quietly even if pride prevented a retraction. Unfortunately, that hasn't happened and other "analysts" and news outlets have picked up the story. So, I need to print a correction for them. Unconventional, I know, but I stand for Truth.
The simple fact is that 2-year inflation expectations have fallen deeply, but remain well above zero. The chart below, also from Bloomberg, shows 2-year inflation swaps over the same period. You will notice that it has fallen mightily but remains at about 0.70%.

It turns out that the difference between the Jan-17 TIPS (which have 2 years to maturity) and the Jan-17 nominal Treasuries that are their comparator bond - taking the difference between real and nominal rates gives you the "breakeven" inflation rate that makes them equivalent investments; thus the name - is also about 0.70%.
So why does Bloomberg say the 2-year breakeven is negative? Well, Bloomberg's "policy" is to track the April-2016 TIPS as the "2-year" TIPS until the new April-2020 TIPS are auctioned in April At that time, they will roll to using the April-2017 TIPS, which will have two years to maturity, and will use that bond for a year. While I applaud Bloomberg for having a policy, that's no excuse for a stupid policy. There is no place in this universe where the April-16s are a 2-year note. Not even close. And not the "best we can do."
In truth, especially for short-dated inflation expectations there is no reason not to use inflation swaps. The 2-year inflation swap is evergreen each day with a new 2-year maturity, and there are no idiosyncrasies (such as the fact that the April issues often trade cheap because of the bad seasonality associated with them, so they will usually understate true inflation expectations if you use them) to worry about.
So the story is false. The market is not discounting two years of deflation. Indeed, the reality is quite a bit different. The chart below (source: Enduring Investments - we know stuff like this) shows the 1-year inflation rate, starting 1 year from now (the 1y1y or 1x2 if you like), derived from CPI swaps. While it has come down substantially since the summer, it is not particularly out of line. In fact, it's pretty much right where core inflation is, which makes sense: the energy spike lower is not going to continue year after year, which means that once it stops then headline inflation will return to the neighborhood of core...unless there's a rebound in gasoline, of course. But the point is that the best guess of inflation one year from now has little to do with gasoline.

Actually, the even-deeper point is that it is appalling how little general knowledge there is about inflation, and how journalists and even many analysts have scant idea how to get to the real story. (Hint: calling an inflation expert is a good start.)
You can follow me @inflation_guy!
Enduring Investments is a registered investment adviser that specializes in solving inflation-related problems. Fill out the contact form at http://www.EnduringInvestments.com/contact and we will send you our latest Quarterly Inflation Outlook. And if you make sure to put your physical mailing address in the "comment" section of the contact form, we will also send you a copy of Michael Ashton's book "Maestro, My Ass!"


