


Money: How Much Deflation is Enough?
Once again, we see that the cure for all of the world's ills is quantitative easing. Since there is apparently no downside to QE, it is a shame that we didn't figure this out earlier. The S&P could have been at 200,000, rather than just 2,000, if only governments and central banks had figured out a century ago that running large deficits, combined with having a central bank purchase large amounts of that debt in the open market, was the key to rallying assets without limit.
That paragraph is obviously tongue-in-cheek, but on a narrow time-scale it really looks like it is true. The Fed pursued quantitative easing with no yet-obvious downside, and stocks blasted off to heights rarely seen before; the Bank of Japan's QE has added 94% to the Nikkei in the slightly more than two years since Abe was elected; and today's announcement by the ECB of a full-scale QE program boosted share values by 1-2% from Europe to the United States.
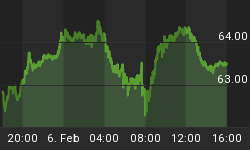
The ECB's program, to be sure, was above expectations. Rather than the €50bln per month that had been mooted over the last couple of days with little currency-market reaction, the ECB pledged €60bln. And they promised to continue until September 2016, making the total value of QE around €1.1 trillion. (That's about $1.3 trillion at today's exchange rate, but of course if it works then it will be much less than $1.3 trillion at the September 2016 exchange rate). To be sure, a central bank always has the prerogative to change its mind, but on the risks of a sudden change in policy please see "Swiss National Bank". It really is remarkable that Draghi was able to drag the Bundesbank kicking and screaming into this policy choice, and it is certain to end the threat of primary deflation in Europe just as it did in the U.S. and in Japan. It will likely also have similar effects on growth, which is to say "next to nothing." But in Europe, deflation risks stemming from slow money growth had been a risk (see chart, source Bloomberg).

Interestingly, y/y money growth had already been accelerating as of late last year - the ECB releases M2 with a very long lag - but this puts the dot on the exclamation point. The ECB has said "enough!" There will be no core deflation in Europe.
Commodities: How Much Deflation is Enough?
Last week, in "Commodities Re-Thunk" and "Little Update on Commodities Re-Thunk", I presented the results of using a generalization of the Erb & Harvey approach to forecast expected long-term real returns for commodities. It occurred to me that, since I have previously played with long-term real equity returns, and we have the real yield on 10-year TIPS as well, that it would be interesting to see if using these figures might produce a useful strategy for switching between assets (which doesn't change the fact that I am a long-term investor; this is still based on long-term values. We merely want to put our assets in whatever offers the best long term value at the moment so as to maximize our expected long-term return).
The answer is yes. Now, I did a more-elegant version of what I am about to show, but the chart below shows the results of switching 100% of your assets between stocks, commodities, and TIPS based on which asset class had the highest expected real yield at a given month-end. Each line is an asset class, except for the blue line which shows the strategy result.

The labels at the top show the asset class that dominated for a long period of time. In 2005 there were a couple of quick crossovers that had little impact, but by and large there were three main periods: from 1999-2005, commodities offered excellent expected real returns; from mid-2005 through early-2008 the strategy would have been primarily in TIPS, and subsequent to that the strategy would have been primarily in equities. Fascinating to me is that the overall strategy does so well even though it would have been invested in equities throughout the crash in 2008. The crash in commodities was worse.
Now what is really interesting is that there is a vertical line at the far right-hand side of the chart. That is because at the end of December, the expected real return to commodities finally exceeded that of equities for the first time in a very long time. For this "selling out" strategy, that means you should be entirely out of stocks and TIPS and entirely in commodities.
As I said, that is the coarse version of this approach. My more-elegant version optimized the portfolio to have a constant expected risk in real terms. It was much less risky as a result (10.5% annualized monthly standard deviation compared to 15.5% for the strategy shown above), had lower turnover, but still sported returns over this period of 9.5% compounded compared to 11.2% for the strategy above. I am not, in other words, suggesting that investors put 100% of their assets in commodities. But this method (along with lots of other signals) is now suggesting that it is time to put more into commodities.
Balls: How Much Deflation is Enough?
Being a football fan, I can't keep from weighing in on one mystery about deflate-gate (incidentally, why do we need to put 'gate' on the end of every scandal? It wasn't Water-gate, it was the Watergate Hotel that proved Nixon's undoing. "Gate" is not a modifier). Really, this part isn't such a mystery but I have seen much commentary on this point: "How did the balls get deflated during the game since they were approved before the game?"
The answer is really simple in the real world: the official picked up one of the balls, said "fine", and put them back in the bag. He has a million things to do before the championship game and in years of refereeing he has probably never found even one ball out of spec. This sort of error happens everywhere there are low reject rates, and it's why good quality control is very difficult. (Now, if you fired the ref every time a bad ball got through, you damn betcha those balls would be measured with NASA-like precision - which is perhaps a bad metaphor, since similar issues contributed to the Challenger disaster). The real mystery to me is: if the Patriots truly think they are the better team, why would they cheat, even a little? As with the CHF/EUR cross that we discussed yesterday, the downside is far worse than the gain on the upside.
Or, is it? The NFL will have a chance to establish the cost of recidivism in cheating. Maybe the Patriots were simply betting that the downside "tail" to their risky behavior was fairly short. If the NFL wants to put a stop to nickel-and-dime cheats, it can do that by dropping the hammer here.
You can follow me @inflation_guy!
Enduring Investments is a registered investment adviser that specializes in solving inflation-related problems. Fill out the contact form at http://www.EnduringInvestments.com/contact and we will send you our latest Quarterly Inflation Outlook. And if you make sure to put your physical mailing address in the "comment" section of the contact form, we will also send you a copy of Michael Ashton's book "Maestro, My Ass!"


