


The gold price has been buoyant in recent months while silver has mostly lagged, prompting many to question the gold trend. My analysis of the market leads me to believe that this concern is a bit premature, so the focus of this article will be on the individual trends of the two metals as well as the tie-in with the housing bubble.
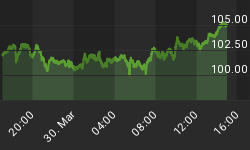
First, the yellow metal. Gold has obviously been struggling under the weight of the overhead supply that built up after the previous intermediate-term peak late last year. This supply is still a force to be reckoned with in the near term, which makes the chart resistance beginning around the $455-$457 area important to watch. This is approximately where the upper boundary of the developing uptrend channel intersects in the daily chart (see below). With the August "channel buster" test of this upper boundary at the $455 area, a re-test of $455-$457 in September would probably be followed by a similar sharp pullback to test the uptrend line formed by connecting the July low with the late August low (see chart).

But short-term considerations aside, the wave form of the gold price appears to be suggesting that the intermediate-term trend for gold will remain buoyant as we head into 2006. This is also suggested by the dominant interim moving averages (30/60/90-day Mas) which are gradually aligning properly and turning up for the first time since late last year.
Silver, meanwhile, has had a much rougher go of it than gold has this summer. After the last meaningful peak in early June, silver has declined in a controlled fashion to twice test the lower boundary of its interim downtrend channel shown in the chart below. A brief penetration beneath the channel's lower boundary in late August (see circled area in chart) qualifies as a "channel buster" exhaustion signal and gave rise to the brief rally back up above the $7.00 level. Silver could pull back again to re-test the lower channel boundary, but the bottoming process appears to be well underway, and any further penetration beneath $6.70 would only succeed in putting silver into an even greater "oversold" position and thus ripe for a rally back up to the upper boundary of the trend channel.

As we all know, the price of gold is a good measure of the overall levels of inflation within the economy. Yet, as many financial analysts have pointed out throughout the year, the Federal Reserve's money supply statistics do not reflect this "inflation" (which is strongly detectable in several inflation-sensitive commodity markets). Bob Prechter of the Elliott Wave Theorist has pointed out that it's possible to have "inflation" in the economy as well as for key commodity prices while the money supply is in decline (on a rate of change basis). Conversely, the money supply trend can be roaring upward as it was in the mid '80s with no discernable inflationary effects in the economy.
It's no secret that money supply has been declining on a rate of change basis for some time now. So if the inflation in the U.S. isn't reflected in the monetary aggregates, then where is it coming from? I believe it's coming at least partly as a spill-over from the white hot housing and property markets.
For instance, it has recently been publicized that Americans have been drawing down on their home equity at record levels. New loans are constantly being created in various ways through the real estate market and this is what's keeping the consumer highly liquid and able to maintain their high standards of living. This is part of the process I described several months ago as a slew of financial products would be created to keep not only the real estate bubble inflated, but in turn to keep the U.S. consumer in an overall state of financial health since this is necessary for the sake of fully integrating the global economy (GEO).
Along these lines, an article appearing recently in the London Financial Times under the headline "Green light for property derivatives" described how groups which control nearly $81 billion of commercial property have been given the green light to trade in the fledgling property derivatives market. Just when you thought the global real estate bubble couldn't get any bigger, more incentive and greater flows of capital will now be made available to keep it going.

Above you'll see the Dow Jones REIT Index chart. After a scary pullback to test the dominant interim 90-day trend line in August, the REITs appear to have recovered and are on their way to re-testing the highs made in late July and early August. As you know, the REITs are an important measure of the internal health of the real estate market and are to a large degree a leading indicator for the broad U.S. property market. Note how well the gold price correlates to the price trend of the Dow Jones REIT Index since the inflation-driven market trends began in earnest in the second quarter of 2003. Could we not see the gold price eventually pick up steam to re-align with the real estate boom as a response to the liquidity coming from this sector? More on this later...


