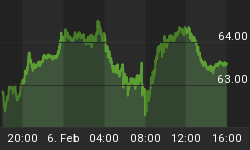
Last weekend, I expected the US stock market to drop suddenly from Monday into Tuesday. While I expected about close to a 2% drop, we got closer to a 1% drop instead (I give myself a C grade there). Out of this cycle low Tuesday (Gann 4/8/12 and Wall Cycle 22.5 TD low), we rallied 1.3%. I also talked about the prevailing 32 TD top due Thursday this week, which I believe came a day early on April 15th. There has been much talk about Lindsay's methods, and his method agrees with me that we made an important top on April 15th.
The charts below show that a 5% drop is imminent into April 24th, which follows the recent 7 Trading Day drops, (especially notable is the early to mid December drop of 5%). It also agrees with the 8 TD cycle, as well as the larger Gann 16 TD +/- 4 cycle low. The e-wave set up is there, and we are now going from Wave (b) to Wave (c) of an a-b-c type drop from the March 2nd top to April 24th (a 31 TD low from Mar 11).
Of note: the NASDAQ failed to keep up with the Dow and SPX today creating an inter-market bearish divergence. There are also important reversal signatures on the "astro" scene this week. Notable is Pluto Retrograde on April 16 and Mars sq. Jupiter on April 17. According to Merriman, Pluto rules debt and bonds. Is the FED going to say something that spooks the market? Stay tuned.
In my opinion, this would be the time to buy puts or heavily leverage positions to the down side. The odds favor the bears here... at least into April 24th... and after that? Well, it is after all a bull market, right? Yeah, buy the dip... this is the mantra going forward. I don't see anything to change that viewpoint ... yet.
The BluStar Market Timer was rated #1 in the world by Timer Trac in 2014 (and from April 1, 2014 through March 31, 2015), competing with over 1600 market timers. This occurred despite what the author considered to be a very difficult trading environment. Brad Gudgeon, editor and author of the BluStar Market Timer, is a market veteran of over 30 years. The subscription website is www.blustarmarkettimer.info To view the details more clearly, you may visit our free chart look at www.blustarcharts.weebly.com This web site is also updated periodically as events unfold.


