


For quite some time I've spoken about the look of those nasty monthly charts across the board. While the market stopped going higher, it didn't break lower and I believe many of you thought they'd never play out. They had to. They really had no choice. Every rubber made has a breaking point. You can try to be cute by continuing to stretch them and think to yourself, let's see if this particular one defies what we know to be true. Truth always wins out in the end. Eventually it snaps and you feel the pain of that snap. The further you stretch the more pain your hand (or wallet) will feel. The monthly charts, make no mistake about it folks, have clearly kicked in and has done so in a very large way that the bulls never thought possible.
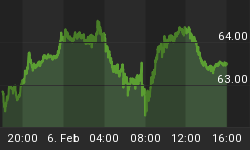
Notice the reversal candle the first one we've seen in years on the Nasdaq which stalled out near our year 2000 highs area seen below:

The month of August started out fine but we saw nothing but the usual whipsaw. Then came yesterday and the first move below 2040 on the Sp. Not a huge move below but five points a start. The bears knew they needed the big gap down and to do so in to oversold short term index chart conditions. That hasn't happened in longer than we can remember. The bears received the assistance they needed with another melt down in China. A four plus percent move lower. Europe naturally followed along with their own huge move down and of course we followed right behind. The large gap down allowed rsi's to reach the mid teens on the sixty minute charts and even 30 on the daily charts. It didn't matter. We kept on going and going and going further still. We look at the indexes at the close and our eyes bulge out of their sockets. The combination of those monthly overbought, bearish looking charts and longer term froth finally catching up but doing so in a way no one thought really possible. I warned more times than I can count that risk was extremely high due to these problems facing the market and today we saw the break down all bulls feared. A full, complete break with force on high volume. The real deal. Not to be ignored. So for now we turn to those monthly charts and the look of them says there's likely, over time, more pain to come but we are extremely oversold so some type of snap back will occur but 2040, if we can get that high, will be incredibly tough resistance. The bears can sleep well this evening. The monthly charts have become their friend.
Please take some of your time and study these monthly charts available for your viewing. Aapl, banks and those semiconductors. They tell a big tale. Aapl breaking a six year up trend line at $112.00 with the Macd pointing straight down and crossing bearish. That is one incredible ugly and telling chart about the state of the market in many ways since Aapl is in just about every important index. When the leader of all leaders breaks and it's so wide spread around the market, it's hard to imagine anything really positive happening for the market other than the usual strong snap back rallies that occur from extreme levels of oversold.
See the AAPL Monthly Chart below:

The snap backs are usually very powerful but also very short term in nature. One to two days at best for the most part. Aapl is now a very broken stock that's not likely to get back over 112.00 for a very long time. Anything is always possible but I doubt Aapl sees 112+ for longer than most of you think possible. The semiconductors have long ago broken and led the way lower. They are, for the most part, telling us that the economy is indeed slowing with most of the pain coming from Asia and Europe. It's not great here but the problems abroad keep taking this sector down further than anyone I would think thought possible. Then there's the most important one of all. The leading sector in this bull market. The banks. They have been unbreakable. They have been the back bone. They are snapping big time here. Major technical damage and while they're not totally in bear market territory yet, they're rapidly working their way in that direction. They are breaking. They now have major technical damage they are unlikely to recover from. The last index standing bullish has turned more bearish. Nothing to help the market any longer. Nowhere to rotate in to which has been the case until now. The monthly charts displaying a very nasty overall picture of this markets health. It needs a doctor badly. I don't think there's one around to save it short term except again, for those one to two day counter trend rallies.
See the Monthly SMH/Semiconductor chart below which has cleared our 2009 Support Line as well:

On to the world of sentiment. You all know by now that my second or co-first biggest worry has been longer term sentiment. Monthly charts and sentiment. We spent over one a half years with the bull bear spread over 30% save for two weeks last October. Four weeks ago we broke that chain of 30+ readings as the market refused to break out thus more and more bulls started giving up. It was the first good sign that at least some of the froth was going away. The move lower on the spread was mostly bulls turning agnostic simply because we hadn't lost Sp 2040 yet. Still enough hope out there to prevent too many folks to turn out right bearish. The spread has been falling a bit more rapidly now with the reading from last Friday's close at a bit over 19%. A really good number but far from what we ultimately need after so long a period of massive froth. With the action from today and this week overall it is my belief we will see the number next Wednesday through today's close approaching 10%. In time a reading below zero may be very necessary but for now it's important to see more who were agnostic turn bearish. Ramp up the bears and we'll see the number near 10% next Wednesday. I believe that's what happened this week. Near 10% is likely our new reading as fear kicks in below Sp 2040. Now is the time where we will see a rapid acceleration in terms of bearish thinking which very long term is great news for the bulls. A lot of pain now for more gain later. Sentiment is headed in the right direction now folks so feel good about that. Lots more, however, still needs to be done.
The feds job as you may know by now is as a 401k manager. Her job is to manage your 401k's so as to keep the economy moving in the right direction. If we lose the stock market we lose money in our 401k's and we stop spending so she's only concerned with keeping you happy when you get those statements every three months. With the market plunging she knows she's about to lose the consumer in a very big way and thus it may soon be tricks time. What she can do to help get investors excited about being long the market. Get folks back in and get the market higher. First little trick will likely be telling the world that rates will now remain at zero for the foreseeable future. The next trick, if the selling accelerates big time, would be to offer up Qe4. Makes me sick thinking about this as a reality but she'll do whatever it takes to make this market stop falling if it really begins to accelerate to the down side. I don't know what that level would be but we're probably not that far away from hearing about her bag of tricks. I wish she would just disappear and let things happen naturally but she'll try to interfere sooner than later is my belief. Stay tuned.
In closing, 2040 on the Sp is now very powerful resistance. To the down side we can see 1904/1909 where there's an open gap from last October. That's the new trading range we can focus on. 2040 on the top side with 1904/1909 on the bottom of the ledger. I would advise to keep most of your cash in your pockets. It may be the best position for a long time to come. You should expect a counter trend rally up soon as the put call readings are at extremes along with extremes in the short term rsi's on the key index charts. That said, the tide, overall, has turned bearish for now.
Join us for a free 3 week trial at www.TheInformedTrader.com


