


This was a fairly quiet week in the market for the metals, with a min-rally on Thursday especially in silver which hit almost $15. By the end of the week, the price of gold was down $13 and the price of silver was up 3 cents. The action was elsewhere (e.g. equities and currencies).
We don't think that the price action necessarily tells us anything by itself. That's why we look at it in the light of the basis action -- the spread between spot and futures. What happened to the fundamentals of the metals this week? Read on...
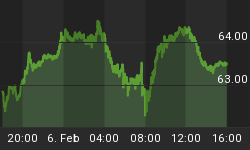
First, here is the graph of the metals' prices.=
The Prices of Gold and Silver

We are interested in the changing equilibrium created when some market participants are accumulating hoards and others are dishoarding. Of course, what makes it exciting is that speculators can (temporarily) exaggerate or fight against the trend. The speculators are often acting on rumors, technical analysis, or partial data about flows into or out of one corner of the market. That kind of information can't tell them whether the globe, on net, is hoarding or dishoarding.
One could point out that gold does not, on net, go into or out of anything. Yes, that is true. But it can come out of hoards and into carry trades. That is what we study. The gold basis tells us about this dynamic.
Conventional techniques for analyzing supply and demand are inapplicable to gold and silver, because the monetary metals have such high inventories. In normal commodities, inventories divided by annual production (stocks to flows) can be measured in months. The world just does not keep much inventory in wheat or oil.
With gold and silver, stocks to flows is measured in decades. Every ounce of those massive stockpiles is potential supply. Everyone on the planet is potential demand. At the right price, and under the right conditions. Looking at incremental changes in mine output or electronic manufacturing is not helpful to predict the future prices of the metals. For an introduction and guide to our concepts and theory, click here.
Next, this is a graph of the gold price measured in silver, otherwise known as the gold to silver ratio. The ratio moved down this week, though it is still in what most people would call a breakout.
The Ratio of the Gold Price to the Silver Price

For each metal, we will look at a graph of the basis and cobasis overlaid with the price of the dollar in terms of the respective metal. It will make it easier to provide brief commentary. The dollar will be represented in green, the basis in blue and cobasis in red.
Here is the gold graph.
The Gold Basis and Cobasis and the Dollar Price

The price of the dollar rose slightly, and the scarcity (i.e. cobasis) of gold went up along with it.
The fundamental price retreated slightly, but it's still $120 over the market price. Gold remains on sale at a discounted price.
Now let's look at silver.
The Silver Basis and Cobasis and the Dollar Price

The price was basically flat and the cobasis fell slightly.
The silver fundamental price remains more than 50 cents above the market price.
It should be noted that we calculate a fundamental gold to silver ratio over 80, and the market ratio is currently 77.
Monetary Metals may sponsor an event in London in early October, and another in Sydney in late October, to discuss economics and markets, with a focus on how to approach saving, investing, and speculating. Please let us know if you may be interested in attending either one here.


