


Let us begin with this: there is nothing inherently healthy about a series of +2% and -2% days within a range.
Having some grey hair (just a little!) is helpful in times like these because markets go through repetitive phases and it helps to have some historical comparisons to be able to guide an investor. At the same time, experience can be limiting if we try to force everything we are seeing into a particular historical comparison.
So, for example, I never view with anything but amusement the charts of day-by-day comparisons between this year's market action with, say, that of 1929. Or, as another example I have seen: comparing a market to the Nikkei crash in the early 1990s. These are interesting an amusing market parallels, but there is no road map to markets. There is only a contour map.
The contours of this market are reminiscent to me of the end of the tech-led bull market in 2000. The valuation parallels are obvious, but I am not talking about that. In 2000, as the market crested in March and began to head lower, we started to have very large overnight moves - sometimes higher, sometimes lower - followed often by a sharp open, directionless trading during the day, and often a sharp move at the close. This was the signature of fast money, which tends to get more timid during the daylight but which enjoys monkeying about with buy and sell stops overnight. In general, as the market headed lower, it seemed like Mondays tended to be pretty good, and Fridays tended to be pretty bad as no one wanted the weekend risk. There was a lot of volatility, and some spectacular up days. But month after month, the market was more likely to end the month lower than it began.
I think we are in that mode again, although it is hard to tell if we have anything like that kind of bear market ahead of us. Certainly, we can make that point valuation-wise. Also, interest rates have much more room to move higher from here than to move lower. While I think the economy is slowing, and any Fed action is likely to be small, tentative, and probably delayed, my point is that interest rates are not likely to provide a following wind to valuations.
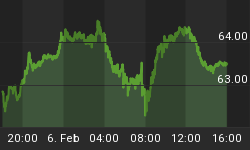
Indeed, while nominal interest rates are still locked near 2% on the 10-year note, real interest rates are near the highest levels in five years (see chart of 10-year real interest rates, source Bloomberg).

The flip side of stable nominal interest rates and rising real rates, of course, is declining inflation expectations. By our calculations, the market is currently implying core inflation to be below the Fed's target for at least a decade. And this is despite the fact that, measured by median inflation, it is already at target.
I once believed that the Fed could not really control long-term interest rates, although at least in principle they can control Treasury rates like they did in WWII, by simply buying or selling whatever it takes to keep rates at their target (it was easier then, as the market was a lot smaller!). And I guess that, deep in my gut, I still believe that. But I must admit that the evidence that they can control nominal interest rates, at least in normal times (that is, when the weight of the market doesn't strenuously disagree), is starting to look pretty strong. There is absolutely no rationale for 10-year nominal interest rates at 2% in an environment where real interest rates are 0.65%, current inflation is 2.3%, and there is a large amount of money in circulation - with no plans in place to drain it.
(For anyone claiming a fear of deflation, I just shake my head in disbelief. Choose: Do you want to be a monetarist, in which case you have to construct a case for deflation from 6+% money growth and money velocity that is already at levels below any previously measured; or do you want to be a Keynesian and explain how you get deflation with unemployment at 5.1%? The third way is hand-waving, claiming that large amounts of debt lead mystically to deflation. But large amounts of public debt have never led to deflation in the past, and there is no obvious mechanism for it to do so.)
My reading of the contour map suggests a market valley ahead. It is a deep valley, but the good news is that there is a mountain on the other side of it. There always is.
I may have the lay of the land wrong, but I have been over this ground before. Watch your step.
You can follow me @inflation_guy!
Enduring Investments is a registered investment adviser that specializes in solving inflation-related problems. Fill out the contact form at http://www.EnduringInvestments.com/contact and we will send you our latest Quarterly Inflation Outlook. And if you make sure to put your physical mailing address in the "comment" section of the contact form, we will also send you a copy of Michael Ashton's book "Maestro, My Ass!"


