• 316 days Will The ECB Continue To Hike Rates?
  • 317 days Forbes: Aramco Remains Largest Company In The Middle East
  • 318 days Caltech Scientists Succesfully Beam Back Solar Power From Space
  • 718 days Could Crypto Overtake Traditional Investment?
  • 723 days Americans Still Quitting Jobs At Record Pace
  • 725 days FinTech Startups Tapping VC Money for ‘Immigrant Banking’
  • 728 days Is The Dollar Too Strong?
  • 728 days Big Tech Disappoints Investors on Earnings Calls
  • 729 days Fear And Celebration On Twitter as Musk Takes The Reins
  • 731 days China Is Quietly Trying To Distance Itself From Russia
  • 731 days Tech and Internet Giants’ Earnings In Focus After Netflix’s Stinker
  • 735 days Crypto Investors Won Big In 2021
  • 735 days The ‘Metaverse’ Economy Could be Worth $13 Trillion By 2030
  • 736 days Food Prices Are Skyrocketing As Putin’s War Persists
  • 738 days Pentagon Resignations Illustrate Our ‘Commercial’ Defense Dilemma
  • 739 days US Banks Shrug off Nearly $15 Billion In Russian Write-Offs
  • 742 days Cannabis Stocks in Holding Pattern Despite Positive Momentum
  • 743 days Is Musk A Bastion Of Free Speech Or Will His Absolutist Stance Backfire?
  • 743 days Two ETFs That Could Hedge Against Extreme Market Volatility
  • 745 days Are NFTs About To Take Over Gaming?
Strong U.S. Dollar Weighs On Blue Chip Earnings

Strong U.S. Dollar Weighs On Blue Chip Earnings

Earnings season is well underway,…

The Problem With Modern Monetary Theory

The Problem With Modern Monetary Theory

Modern monetary theory has been…

  1. Home
  2. Markets
  3. Other

Elliott Wave Analysis On USDCHF And GBPUSD

USDCHF

Finally, USDCHF has turned sharply to the downside in the last few days, clearly in impulsive price action that can cause even more weakness in the next few days. We are looking to lower levels in wave C of a black wave 4 that can even look for 0.9780 once again where we would expect to see a bottom formation of a big corrective wave four that is unfolding since November 2015.
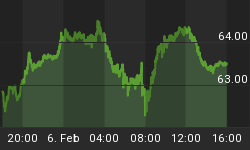
USDCHF, 4H

USDCHF 4-Hour Chart


GBPUSD

GBPUSD fell strongly in January after the price took out 1.4560 level from where we have seen a decline into our Fibonacci support levels near 1.400. Notice that fall was extended, so it must be impulsive as part of a much bigger bearish cycle. However, market never moves in straight lines so we need to be aware of a corrective price actions. Well, we have seen a nice bounce in the last two weeks to 1.4700 that we see it as wave four within ongoing bearish trend. That said, traders must be aware of a new turn down in days ahead, for wave 5 of III.

GBPUSD, Daily

GBPUSD Daily Chart


If you like our trading analysis, you can visit our website at --> www.ew-forecast.com


Back to homepage

Leave a comment

Leave a comment