


1. Market Update
Since my last report Gold has continued its volatile range trading between $1,225 and $1,280. Although the bulls are still somehow in control there is no clear trend and you might do yourself a big favor if you just stay at the sidelines here.
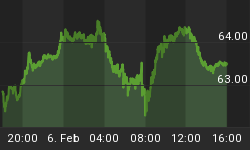
Bitcoin instead behaves more convenient and less volatile for now. Bitcoin seems to approach the apex of its multi-month triangle. A decision is close and a strong move likely to happen soon.
Regarding the stock-market it is still not clear whether we are indeed already in a bear market or whether the nasty start into 2016 was just a correction. The expected recovery since mid of february has definitely been impressive. And with negative interest rates and expansive money policies there are strong reason to be invested in the stock-market. But overall uncertainty is high and therefore volatility remains at nerve-racking levels. Short-term stocks are overbought but I do like the biotech sector. It's down nearly 40% and might benefit the most in a stock bubble mania. I have added two ETFs to the watch list...
Another sector which is getting my attention is agriculture. Especially the grains are interesting and promising. I am issuing a new buy recommendation here!
Overall keep in mind that we are approaching a timeframe which is not very supportive seasonal wise.
2. Bitcoin consolidation about to end soon

Bitcoin is approaching the apex of its triangle. A decision and therefore a big move is getting imminent. But since it now looks like a symmetrical triangle the breakout could happen to downside too. So far Bitcoin behaves bullish but to make sure that our winning trade does not turn into a looser we are moving the stop towards $382.00.
Action to take: Hold your Bitcoins and let your winnings run. Don't buy here.
Stop Loss: Increase your stop to $382
Profit Target: $800
Timeframe 6 -18 months
Initial Risk($80) / Reward($430) = 1 : 5.4 (very good ratio!!)
Position Sizing: Don't risk more than 1% of your equity.
3. The Midas Touch Gold Model neutral since March 14th

Compared to last week we have two new bullish signals:
SPDR Gold Trust Holdings
GDX Gold miners
And four new bearish signals are coming from:
Ratio Gold/Oil
Gold in Indian Rupee
Gold in Chinese Yuan
GDX Gold miners Sentiment
Overall the model has been moving between bull and neutral mode during the last five weeks. Most of the time it's been bullish. From a trend following perspective Gold is still bullish in US-Dollar. But the negative seasonal outlook as well as the very high commercial net short position delivering strong bearish signals.
The model's conclusion is to stay at the sidelines.
4. Gold volatile range trading

Gold had a spectacular start into 2016 but since 11th of February it is basically stuck in a volatile consolidation. After breaking out of a pennant on march 3rd it failed to push through the resistance zone between $1,270 and $1,280. After a marginal new high last Friday a larger pullback seemed to have finally started but with yesterday's FOMC meeting the bulls are clearly back and have been able to push Gold towards $1,270 once again. Basically all that Gold did during the last five weeks was drawing in many new and speculative ETF buyers without making any significant progress in its price while the commercial hedgers have ramped up their shorts into this wild back and forth range trading.
From a technical point of view this weeks pullback has been the first and successful test of the new up trend line. If Gold indeed is running in this trend channel it should not fall below $1,232 anymore. On the upside the next target is $1,325. Note that Gold remains short-term overbought for quite some time already, but a young bull can stay overbought much longer too. More concerning are the negative divergences forming in the RSI and MACD. Also on a weekly basis Gold has not yet managed to sustainably break out of the three year downtrend channel which currently sits around $1,250. This makes $1,250 a pivot point and its no wonder that we can observe such a fierce battle here.
It would not be a surprise seeing Gold rallying until $1,325 only to start a massive correction from there. But also a whipsaw consolidation over the next couple of months is quite possible. Another option would be a bearish rising wedge with another marginal new high followed by a severe sell off. Generally the most likely outcome will be a test of the 200MA until summer. That would mean a pullback towards $1,180 and maybe even $1,140. But so far there are really zero sell signals and if you have missed the train you simply have to be patient and wait for the chance to buy the next larger dip. I am pretty sure it will come until summer. Another important advise is not to short this market. A young bull will do everything to confuse and kill the bears.
Action to take: Nothing. Stay at the sidelines but plan to buy with both hands once Gold is pulling back towards its 200MA ($1,136). Practice patience!
Investors should buy with both hands if Gold moves below $1,150 again until you have at least 10% of your net-worth in physical Gold and Silver.
If you are afraid of missing out something you can buy physical silver here, It's cheap, hated and seems to have started a new up trend It's not as stretched as Gold and the Gold/Silver-Ratio recently peaked at 84.
5. Grains running into a falling wedge

Since mid of 2012 grains are in a massive downtrend. The iPath Bloomberg Grains Sub index ETF has lost nearly 55%. But since three weeks we are witnessing some signs of life with a first recovery. The ETF is looking very promising here. RSI and Stochastic have not confirmed the recent lows anymore. Sentiment and CoT are very supportive while seasonality is sending mixed signals for Soybeans, Corn and Wheat over the next 6 months. Optimism has been exceptionally low with record bets against markets like wheat. Short-term the ETF is in an up trend and has an embedded Stochastic on the daily chart. Therefore the up trend is locked in and likely to continue.
Action to take: Buy the iPath Grains ETF (JJG) below $30.50
Stop Loss: $27.50
Profit Target: at least $39.00 maybe even $48.00
Timeframe 3 -12 months
Risk($3.00) / Reward($8) = 1 : 2.7 (acceptable ratio) Position Sizing: Don't risk more than 1% of your equity.
6. Portfolio & Watch list...
Portfolio: We bought Bitcoin at $372. New stop at $382. Profit target $800. Plan to hold for a couple of months.
Buy JJG (iPath Bloomberg Grain Total Return Fund) below $30.50. Place a stop at $27.50 and plan to hold it for at least 3 months.
Buy Gold at $1.140 with a stop at $1.100. Mostly likely we will have to wait until march for this trade to become possible.
Buy GDX (Market Vectors Gold Miners ETF) at and below $15.45 with a stop at $14.00
Buy GDXJ (Market Vector Junior Gold Miners ETF) at and below $21.15 with a stop at $19.00
Watch list...: DRD Gold (DRD)
Endeavour Silver Corp. (EDR.TO)
McEwen Mining (MUX.TO)
MAG Silver Corp. (MAG.TO)
United States Oil Fund (USO)
Agriculture ETF (DBA)
Biotech iShares Nasdaq (IBB)
S&P Biotech Bull 3x (LABU)
Track-Record: We got stopped out of our gold short position on January 4th at $1,083 for an outstanding gain of $97/contract or 8.2% (=8.08R).
7. Long-term personal beliefs (my bias)
Officially Gold is still in a bear market but the big picture has massively improved and the lows are very likely in. If Gold can take out $1,307 we finally have a new series of higher highs. If this bear is over a new bull-market should push Gold towards $1,500 within 1-3 years.
My long-term price target for the DowJones/Gold-Ratio remains around 1:1. and 10:1 for the Gold/Silver-Ratio. A possible long-term price target for Gold remains around US$5,000 to US$8,900 per ounce within the next 5-8 years (depending on how much money will be printed..).
Fundamentally, as soon as the current bear market is over, Gold should start the final 3rd phase of this long-term secular bull market. 1st stage saw the miners closing their hedge books, the 2nd stage continuously presented us news about institutions and central banks buying or repatriating gold. The coming 3rd and finally parabolic stage will end in the distribution to small inexperienced new traders & investors who will be subject to blind greed and frenzied panic.
Bitcoin could become the "new money" for the digital 21st century. It is free market money but surely politicians and central bankers will thrive to regulate it soon.
If you like to get regular updates on this model and gold + bitcoin you can subscribe to my free newsletter here: http://bit.ly/1EUdt2K


