


Market Summary
Stocks posted their worst week since mid-February despite a massive rally in crude on Friday. Bond prices remain at elevated levels and were up again this week. Minutes of the Fed's March meeting released Wednesday showed officials highlighted persistent risks facing the global outlook and the threats they posed to the health of the U.S. economy. With traders giving about a 50% chance of a rate increase by December, gold is the main beneficiary as indicted in the chart below. The metal has climbed 17% this year as the dollar sank, spurring demand for alternative assets like gold and treasuries. For the week, the S&P 500 Index, Dow Jones Industrial Average rose and Nasdaq each fell 1.20% while the small cap Russell 2000 fell 1.80 % for the week.

A standard chart that we use to help confirm the overall market trend is the Momentum Factor ETF (MTUM) chart. Momentum Factor ETF is an investment that seeks to track the investment results of an index composed of U.S. large- and mid-capitalization stocks exhibiting relatively higher price momentum. This type of momentum fund is considered a reliable proxy for the general stock market trend. We prefer to use the Heikin-Ashi format to display the Momentum Factor ETF. Heikin-Ashi candlestick charts are designed to filter out volatility in an effort to better capture the true trend. Last week we said, "...the market is moving higher on weak momentum. This indicates that buyers may be getting exhausted. The recent market surge has primarily been inspired by Fed pronouncements and not necessarily because of strong economic data..." As highlighted in the updated chart, the weak uptrend has converted into a trading range. Also noted is momentum starting to turn negative which should help resolve the overbought condition. Expect MTUM to break out of the trading range to the upside if the longer-term uptrend remains intact.

Last week's analysis mentioned "...We like to compare the DOW Industrials and Transports to confirm the current market trend...the DOW Transports are starting to diverge away from the DOW Industrials. We need to keep an eye on this trend because if it continues this indicates weakness in the current uptrend and unless both indexes converge higher, it will be difficult for the DOW Industrials to continue going up..." As we suggested, the Dow Industrials ended the week with loss.

Last week we pointed out how "... the Russell 2000 is lagging the larger cap indexes. The Russell 2000 tends to lead the market when investors are committed to "risk-on" trading...If the small cap Russell 2000 doesn't catch up with the other indexes it might signal upward price movement will stall out sooner rather than later..." The Russell 2000 continues to lag and as discussed above, the stock uptrend appears to be eroding.

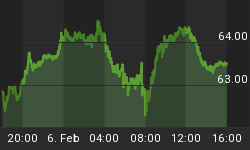
After falling to a nearly 18-month low against the yen earlier in the week, the dollar's Friday gain snapped a five-day losing streak. The buck still managed to log its largest weekly drop against the Japanese currency since the week ended Feb. 12, falling 3.5%. The dollar fell 4.1% in the first quarter of 2016. Currency concerns may be a near-term catalyst as the Japanese Yen continues to rally and hit fresh highs against the U.S. Dollar going back to October 2014. It may be another sign that Central Bank policies may be causing a loss of control for markets. Dollar-denominated assets like gold and treasury bonds trended higher as the dollar retreated. Though the Fed is formally on the record for two rate hikes this year, the treasury markets appear to be pricing in just one hike at the very most and perhaps none at all this year. Gold gained the most in a week after Federal Reserve minutes indicated policy makers remained cautious about raising U.S. interest rates, making the precious metal look more competitive against interest-bearing assets.

Market Outlook
The economic data in the U.S. continues to gradually improve, but this is having a limited effect on the stock market, as investors are fixated on the Fed. Fed Chair Yellen hosted a historic meeting with her three previous Fed chairs on Thursday and they reiterated little chance of a recession. Minutes from the most recent Federal Reserve meeting suggested the Fed was unlikely to raise interest rates before June. With quarterly earnings season beginning next week, we could see volatility creep into the market. Expectations for the upcoming quarterly earnings took a massive downgrade over the last few months. Analysts are projecting a third straight quarterly decline in earnings at S&P 500 companies, with a 7.6% year-over-year decline in profits forecast, according to Thomson Reuters data. Some strategists, though, expect more companies than usual to beat extremely low estimates, possibly helping stocks gain in the short term. While economists and analysts lowered their growth numbers, the economy actually expanded and the doomsday scenario has not materialized. This could set up another broad-based beat for corporate results as expectations are extremely low. Investor focus should shift next week from oil and the Fed to quarterly reports, said Peter Kenny, senior market strategist at Global Markets Advisory Group, in Berkeley Heights, New Jersey. "The Street is not expecting much in Q1 earnings, but right now the market is moving as a direct result of dovish commentary from the Fed and crude's ability to rally. That is good news for investors but I'm not sure how long of a shelf life that has," he said. The chart below displays the recovery from the market bottom in February for major asset classes. Notice the even though bonds and gold are the leading performers year-to-date, since the market crash investors have been aggressively buying riskier equity assets.

The CBOE Volatility Index (VIX) is known as the market's "fear gauge" because it tracks the expected volatility priced into short-term S&P 500 Index options. When stocks stumble, the uptick in volatility and the demand for index put options tends to drive up the price of options premiums and sends the VIX higher. In response to the first weekly slide for stocks in two months, Option Volatility finally saw some recovery. The CBOE Volatility Index rose 17% but was at 8-month lows to start the week. Recent analysis is playing out as advertised where we stated "...As recent market risk has subsided expect the VIX to stabilize near the support line, which is the November low...orange circles below denote where in the past, the stock market sank after the Volatility Index fell to the current support level. At the current price, the VIX can provide relatively cheap insurance if stocks do pull back..."

The American Association of Individual Investors (AAII) Sentiment Survey measures the percentage of individual investors who are bullish, bearish, and neutral on the stock market for the next six months; individuals are polled from the ranks of the AAII membership on a weekly basis. The current survey result is for the week ending 04/06/2016. The most recent AAII survey showed 32.20% are Bullish and 21.50% Bearish, while 46.30% of investors polled have a Neutral outlook for the market for the next six months. As indicated in the current AAII survey, retail investors remain definitively neutral about the near-term market direction. Historically low Bullish and Bearish sentiment suggest continued range-bound trading.

The National Association of Active Investment Managers (NAAIM) Exposure Index represents the average exposure to US Equity markets reported by NAAIM members. The blue bars depict a two-week moving average of the NAAIM managers' responses. As the name indicates, the NAAIM Exposure Index provides insight into the actual adjustments active risk managers have made to client accounts over the past two weeks. The current survey result is for the week ending 04/6/2016. First-quarter NAAIM exposure index averaged 45.89%. Last week the NAAIM exposure index was 67.94%, and the current week's exposure is 73.21%. Last week we commented "...the Fed was in no hurry to increase interest rates. This was sweet music to money managers' ears and they started pushing up stock prices...Next week begins quarterly earnings season and if companies report better than expected financial results it is reasonable to expect the NAAIM Exposure index to go higher..." Right on que the NAAIM index is already pushing higher.

Trading Strategy
The Stock Trader's Almanac reports that April option expiration is generally bullish across the board with solid gains on the last day of the week, the entire week and the week after. Since 1982, DJIA and S&P 500 have both advanced 23 times in 34 years on expiration day. Both the S&P 500 and DJIA have been up seven of the past ten expiration days. Expiration week as a whole has a slightly more bullish track record over the past 34 years to expiration day. Average weekly gains are in excess of 1% for DJIA and S&P 500. The bullish bias of April expiration also persists during the week after. DJIA has posted a full-week gain in ten of the last twelve weeks following expiration. Historically April is usually a positive month for the market. The S&P 500 has been positive in April 70% of the time since 1945, and in the past 10 years, April has been the top-performing month. As we have been recommending recently "... An ideal trading strategy is to use price dips as an opportunity to buy shares on your stock watch list. Prices are bit elevated, therefore using spread strategies will help mitigate the cost of entering a trade...all systems are on go as all the major S&P sectors are positive over the past 30 days... We are currently in the middle of what is considered the "best six months of the year" for the stock market. We like undervalued or oversold shares to bid on because the current bullish trend has more room to run..." The updated graph below confirms this analysis is still valid.

Feel free to contact me with questions,


