


A 3-dimensional approach to technical analysis
Cycles - Structure - Price projections
"By the Law of Periodical Repetition, everything which has happened once must happen again, and again, and again -- and not capriciously, but at regular periods, and each thing in its own period, not another's, and each obeying its own law ... The same Nature which delights in periodical repetition in the sky is the Nature which orders the affairs of the earth. Let us not underrate the value of that hint." -- Mark Twain
A Review of the Past Two Weeks
Since the bottoming of the 12-month cycle in October generated a new up-trend in all stock indices, there have been only minor price pull-backs in spite of an extremely overbought short-term condition and mediocre NYSE breadth figures. By contrast, however, the Nasdaq is showing much better technical strength!
Last week, the Standard & Poors 500 and the Nasdaq Composite made a new bull market high, the Dow Jones Industrials traded at an 8-month high, and the Dow Jones Transportation index continues to advance in unchartered stratospheric territory Although the NYSE and the Russell 2000 led the last bull market advance, they are currently slightly lagging.
Everything considered, 2005 appears to be on track to fulfill the decennial prophesy by adding another decade to a perfect, long-standing record.
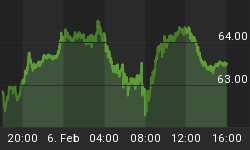
Oil has continued to lose ground and is now trading 20% below its recent high of 70.
Gold was the delight of the bugs this past week rallying strongly from its recent lows and making another long-term high.
As was anticipated, the dollar has stalled after its recovery to 92.
Current Position of the Market.
SPX: Long-Term Trend - Last week more indices joined the Dow Jones Transportation Index in making new bull market highs. This trend is expected to continue for a while longer.
SPX: Intermediate Trend - A new intermediate trend is now solidly entrenched and should prevail for a few more weeks.
SPX: Short-Term Trend - In spite of extremely overbought momentum indicators, prices continue to move higher. However, we are getting close to satisfying short-term projections.
Because of market volatility, the short-term trend is better analyzed on a daily basis with the help of hourly charts. This is done in our daily market updates and Closing Comments.
Daily Market Analysis: If you would like to receive an explanation of how I arrive at buy and sell signals and sign up for a free 6-week trial period of daily comments, please let me know at ajg@cybertrails.com.
What's Next?
The decennial pattern is about to prove itself one more time and extend its unblemished record for another decade. The SPX and other indices made their lows for the year in April/May 2005, and by making new bull market highs along with the Nasdaq last week, it is probably safe to say that overall, 2005 will be an up-year.
The 10-year pattern is caused by the bottoming of the 10-year cycle in the years ending in 4. When the low occurs just after the bottoming of the 4-year cycle, as was the case in 1994, the two cycles subsequently combine to give a strong upward push to the market. But this time, the 4-year cycle low is less than a year away and its effect is already noticeable in the poor breadth figures of the NYSE. The market received another boost from the 12-month cycle which turned up in October, but its influence may be short lived.
If this intermediate (and long-term) up-trend is to continue for a while, some improvement has to come fairly soon to the breadth indicators. The NYSE daily A/D oscillator is already showing some pronounced negative divergence to price and, depending on how you massage the data, it is either neutral or just barely positive. That's not enough to support this rally much longer and a correction could start at any time. Furthermore, the other breadth indicator, the New Highs/New Lows index, is flashing all sorts of danger signals about the intermediate and long term trend. Throughout most of this rally, the NYSE NH/NL data has remained mostly negative. It is true that the Nasdaq NH/NL has fared much better. Perhaps it is due to the fact that the Nasdaq has already made new 3-year highs, while the NYSE has not, and when it does (if it does) the NH/NL data will turn more positive.
I have mentioned before that the stock market moves through the basic process of accumulation-uptrend/distribution-downtrend. This occurs at all fractal degrees and it is another way of observing the interaction of cycles and their effect on price. Elliott formulated his Wave Theory based on this observation, but these patterns of accumulation and distribution are best observed on Point and Figure charts.
P&F charting is one of the oldest forms of tracking stocks. It only uses price data and ignores time and volume. Since the advent of computers and all the glittering technical tools, P&F charting has been relegated to an archaic status. The way that it is mostly used today, in 3X reversal form with 45 degree trend lines, does not do justice to its original purpose.
In addition to showing the accumulation and distribution patterns more clearly, one of the most important features of this charting technique is to give the analyst a good idea of how far prices are likely to carry after they move out of the congestion pattern. There seems to be a consistent relationship between the size of the base (or top) and the length of the ensuing move, and a "count" can be taken which often proves to be quite accurate. The trick is to determine the size of the formation because these take different shapes and where one begins and ends the count is critical. Elliott Wave analysts face the same problem. Nevertheless, let's see if we can get some market insight by analyzing a P&F chart of the SPX.
After touching 1168 on 10/13, the SPX made a basing formation which ended on 10/27 at 1179. This was a very volatile period, and by converting the price action to a Point and Figure chart and using the move above 1200 as the break-out point, one can get a sense of how much accumulation has taken place. As best as I can determine, this base count implies a potential move to 1314. This gives us an indication of how far the current up-trend could carry before a major reversal takes place.
Using this charting technique we can at least get sense of what to expect, and by using other proven technical tools, we can verify the accuracy of our expectations. The first thing that we can do is to verify the P/F projection with another proven method. Let's see if we can match the 1314 projection by using Fibonacci ratios.
Since we have already overcome the previous high of 1245, we have triggered a Fibonacci target zone extending from 1266 to 1293. That comes close, but a little short of the P /F count. However, if we use the last down leg of the bear market from March to October 2002 for our measurement, we get a projection of 1266 to 1383, and this gives more credibility to the P&F projection. But these are measurements to project the final top. Let's see if we can use P&F to find a target for the short-term trend.
Another feature of Point and Figure charting analysis, is that very often the base pattern can be broken into phases which correspond to separate phases of the up-trend. And finally, because of the fractal nature of the stock market, smaller re-accumulation/distribution phases tend to form along the way which can be used to confirm the original base count.
In fact, there is a phase of the base which counts to 1157, and there are confirming counts along the way to the mid-50's, so we can assume that we are probably approaching a short-term top and a period of consolidation or correction. This is also indicated in the hourly chart of the SPX which appears below and which will be analyzed in detail in the chart section.
There were two cycles which were mentioned in the last newsletter. The 20-week cycle is fairly consistent with an average span of 19-21 weeks from low to low, but it is not consistent in how much price weakness it brings at the end of its phase. This depends on its position vis-a-vis larger cycles. It is therefore very possible that this time, it was largely overridden by the 12-month cycle and only caused a 3-day sideways move in the market during the second week of November. The 9-month cycle should still be ahead of us and should be expected to have a greater impact. But upon review, I believe that I may have miscalculated the date of its next low and that it will not be due until January.
The various oscillators that have been discussed in the past will be examined in the chart section.
Crude oil futures have continued to decline. As mentioned earlier, they are now approaching the low 50's which is the level I had anticipated them to reach based on P&F assessment of the top formation made at 70. But since they are very oversold short-term, and prices do fluctuate, I would expect a little bounce before reaching their final target.
Gold is taking advantage of its alleged strong seasonal period which begins on November 17 and goes to January 21, and seems intent on reaching 500. However, a recent article in Financial Sense pointed to the fact that, statistically, holding gold during this period was profitable only 55% of the time. The COTs did anticipate this rally by covering their short positions for 4 consecutive weeks, but last week they showed a slight increase. Furthermore, in contrast with certain periods of the past, this time they have retained the majority of their shorts. Since their forecasting ability has been impressive, it will be interesting to see how they rate this rally by their future behavior.
The US Dollar has stalled around its new recovery high of 92. This was anticipated because that is a very strong resistance area which may restrain its long-term advance for a while longer.
Charts
The first chart in this section is the daily SPX which provides a picture of the intermediate trend. Last Friday's prices are not shown.
Late July represents the former bull market high, and it was surpassed this past week. With an up-move that had only very brief consolidations along the way, the market has become overbought. This is evident in the MSO (modified stochastic oscillator) which is as overbought as it gets. But, as you can see, in June it remained overbought for several weeks while the price index completed its short-term move until it broke its up-trend line. In the current pattern, prices are trading at the top of their channel and show no evidence of deceleration. However, the A/D indicator is showing some very definite negative divergence and this is always a sign that the up-move is probably near a short-term top.
The second chart, the hourly SPX, gives us a better picture of what has happened in the past few days of trading.
On this chart, the MSO has also reached an overbought condition. The A/D oscillator has already turned down and is not likely to make new highs, even if prices continue to move up for a few more hours. Finally, the BSP index shows that a sizeable amount of profit-taking has already taken place, and that little buying pressure is supporting the last 4-hour rally.
The current performance of all three indicators strongly suggests that a short-term top is developing, and pretty much confirms the readings of the daily chart. All that remains is the breaking of the short-term trend line drawn on the price chart for a reversal to begin.
We have assessed by P&F analysis that there is a base target of 1257 as well as confirming counts to 1252/1255. Now, if you look on the hourly price chart, you will see the numbers 1251-1273 written at the top of the chart. This is a Fibonacci projection that was generated by moving above 1243. This also indicates that a top should form in this general area.
What kind of a top? My guess is that this would end the phase that started at 1179, but would not be the end of the intermediate trend. Both P&F and Fibonacci projections call for higher prices, and, in spire of weakening breadth statistics, there is still strong price momentum.
How much retrenchment? I won't be able to assess this until the short-term top has been made, but we have developed good support between 1227/1237, and even stronger one all the way down to 1215. I would not expect the lower levels to even be challenged at this time.
The other two charts are included so that you can compare the performance of the SPX to two of the best leading indicators, and the relative performance of the various indices.


SUMMARY:
The year-end rally is now in full swing and, after a short-term correction, prices are likely to push higher. But there are undeniable signs that an important top will be forming in the next few weeks.
Long-term and intermediate-term investors should take notice.


