


Terminology
For those who are first time reading Trend Watch, please click here to understand the term definition and/or how to interpret it.
Part I - Market Comments
First of all, we made a change in the Signal Update section. In the Hypothetical Return column of WATTS Intermediate-term Signal Status, we've changed it from reporting the hypothetical return figure to "See Model Portfolio".
The reason is quite obvious. In the Model Portfolio, we've suggested 25% long position since 10/31/05. Since the intermediate-term signals still remain SELL, reporting the hypothetical return on the SELL signal is meaningless. Worse, it raise a lots of questions and confusion in our subscribers. We've explained to subscribers that we don't initiate any trend investment based on the intermediate-term signal. The intermediate-term signal is for the backdrop of our system view and the fine-tune of our model portfolio.
It's often that we could see a long position suggestion based on a new short-term BUY signal in a weak intermediate-term SELL signal. Besides, we don't and never suggest any short position for the intermediate-term investors. We always suggest cash and cash-like position for an intermediate-term SELL signal. Thus, nobody suffers the hypothetical loss as we reported it. It's misled and confusing. We figured out that removing the wrongful return reporting may be the solution to it.
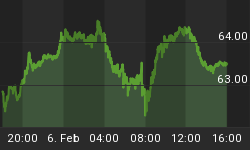
OK, let's go back to the market. The market continued to climb up as one should've expected this week. That is the third week after WATTS issued its short-term BUY signals. For aggressive investors, a significant 5% return is in store in just 3 weeks. That's really good. WATTS is doing its job and doing it quite well. We have no complaints at all. Other than holding your position tight, we can say nothing.
Just only one thing raises some concerns in our mind -- WATTS hasn't issued its intermediate-term BUY signals yet. In terms of price action, the current upward market trend is no doubt, very strong. Following this kind of strong price action, we expect that WATTS should follow its short-term BUY and issue the intermediate-term BUY in 2 to 3 weeks. It hasn't happen yet.
We described this issue in the last 2 signal reading updates that the WATTS signal reading was reluctant to go up with the market. The design of the WATTS system makes WATTS not only able to detect the market trend reversal and indicate the future moving direction, but also able to detect the strength of an on-going market trend. Currently, from the market price action that we can see, it's a strong trend. But from the perspective of WATTS, it's weak. What gives?
To solve the mystery, we went back to the history of the WATTS signal reading for pattern searching and found out that such a reluctant behavior often results in an unhealthy trend. Here we call it "unhealthy" because there is no better word to describe it. Such a trend is not necessarily a very short-lived trend but usually, it does not last for a very long time. Such a trend is not necessarily weak in terms of price action. Sometimes, it could be very powerful just like the current one. We can't call it weak. We can't call it short-lived. It is, however, not as healthy as a strong, long-lived major trend in terms of the WATTS signal reading pattern.
More often, such an unhealthy trend is the result of a counter-trend market movement meaning that such a trend is hardly a trend. More precisely, it's merely a correction for a higher-level trend.
From the WATTS's perspective, the current major trend is still down represented by its intermediate-term SELL signal since mid August 2005. Since then, we have a counter-trend correction in early September 2005. While we still used the term "short-term trend" to call the September's correction in the newsletter, it's actually just a correction to the major downtrend.
However, It's kind of ridiculous for us to call the current upward trend a upward correction in the major downtrend. The closing price last Friday has already surpassed the peak in August 2005. By the definition of the traditional technical analysis, the major trend has already turned up. Not so soon for WATTS. The price action can deceive. The inner structure of a trend monitored by WATTS would be more trustworthy at the time.
Please be aware of the following statement. We are not predicting anything. Don't take our analysis of the WATTS signal reading pattern as a bearish hint and act upon it. We follow the WATTS signals not our analysis. Trying to outguess the WATTS signals will always carry a risk of losing your position and having to acquire it back at a worse price later on. By performing the above analysis, we just want to satisfy our curiosity and share it with you.
True, for aggressive and savvy investors, they can try to squeeze more profits out of the WATTS signals by incorporating the above analysis into their strategy. But we don't encourage it. Some subscribers may even want more signal reading updates to satisfy the above purpose, but we really don't want you to do it. Simply following the signals, you can earn a good return on investment and also enjoy your life.
The reason we are so cautious is that the market can do anything it wants to. A reluctant signal reading pattern can't guarantee anything.
In the long run, the signal reading pattern analysis could be something but we don't have enough data to conclude anything yet. We'll continue to report the signal reading pattern analysis if the similar situation occurs.
Turning to the market side. There are 3 higher highs ranging from 2150 to 2250 for Nasdaq Composite since 2004. The current one is the fourth and also slightly higher than its 3 priors. It would be interesting to see if this breakout can materialize and evolve into a long lasting uptrend. Or the history will repeat and a serious decline will follow after a fake breakout. The current short-term signal from WATTS is BUY. We are joyfully riding on the right side of the market. Maybe we should just relax and let WATTS tell us what to do next.
Part II - Signal Update
WATTS Short-term Signal Status
| Index | Signal Type | Issued Date | Closing Price When Issued | Closing Price Last Friday | Hypothetical Return* |
| NASDAQ | BUY | 10/31/2005 | 2120.30 | 2227.07 | +5.04% |
| S&P 500 | BUY | 10/31/2005 | 1207.01 | 1248.27 | +3.42% |
Last Closed Short-term Signal
| Index | Signal Type | Issued Date | Closing Price When Issued | Closing Price When Liquidate (10/31/05) | Hypothetical Return* |
| NASDAQ | SELL | 9/19/2005 | 2145.26 | 2120.30 | +1.18% |
| S&P 500 | SELL | 9/19/2005 | 1231.02 | 1207.01 | +1.99% |
WATTS Intermediate-term Signal Status
| Index | Signal Type | Issued Date | Closing Price When Issued | Closing Price Last Friday | Hypothetical Return* |
| NASDAQ | SELL | 8/18/2005 | 2136.08 | 2227.07 | See Model Portfolio |
| S&P 500 | SELL | 8/18/2005 | 1219.02 | 1248.27 | See Model Portfolio |
Last Closed Intermediate-term Signal
| Index | Signal Type | Issued Date | Closing Price When Issued | Closing Price When Liquidate (8/18/05) | Hypothetical Return* |
| NASDAQ | BUY | 5/27/2005 | 2075.73 | 2133.08 | +2.76% |
| S&P 500 | BUY | 5/27/2005 | 1198.78 | 1219.02 | +1.69% |
WATTS Bottoming Zone Alert
| Index | Current Signal | Issued Date | Last Signal | Issued Date |
| NASDAQ | None | None | Level-I Alert | 4/15/2005 |
Part III - Model Portfolio Update
Model Portfolio provides investor who doesn't know how to react to the WATTS's signal a simple guideline of how to manage his/her portfolio. If you are interested in following this guideline table, please Read This Important Note first.
| Model Signal | Account Type | Equity Type | Most Aggressive Portfolio | Least Aggressive Portfolio |
| WATTS Short-term Signal | Stock Trading Account (Margin Account) | Stock & ETF | 100% QQQQ | 25% SPY, 25% QQQQ, 50% Cash |
| Mutual Fund | None | None | ||
| Stock Trading Account (Non Margin Account) Self-managed Retirement Accounts (IRAs, 403b...) | Stock & ETF | 100% QQQQ | 25% SPY, 25% QQQQ, 50% Cash | |
| Mutual Fund | None | None | ||
| Company-managed Retirement Account (401k) | Stock & ETF | Not Available | Not Available | |
| Mutual Fund | 100% High-growth Fund, 0% Money Market or Short-term Bond Fund | 25% High-growth Fund, 25% Balanced Fund, 50% Money Market or Short-term Bond Fund | ||
| WATTS Intermediate-term Signal | Stock Trading Account (Margin Account) | Stock & ETF | 25% QQQQ, 75% Cash | 25% SPY, 75% Cash |
| Mutual Fund | None | None | ||
| Stock Trading Account (Non Margin Account) Self-managed Retirement Accounts (IRAs, 403b...) | Stock & ETF | 25% QQQQ, 75% Cash | 25% SPY, 75% Cash | |
| Mutual Fund | None | None | ||
| Company-managed Retirement Account (401k) | Stock & ETF | Not Available | Not Available | |
| Mutual Fund | 25% High-growth US Stock Fund, 75% Short-term Bond Fund or Money Market | 0% High-growth US Stock Fund, 25% Balanced Fund, 75% Short-term Bond Fund or Money Market | ||
PART IV - Optional Reading Material
1. So Long Pensions, Hello Fees? - http://finance.yahoo.com/columnist/article/richricher/1465
Honestly, we are not a fan of the famous Rich Dad, Poor Dad's author, Robert Kiyosaki, mainly because there are too many problems in his theory of getting rich quick and easy. But we do want you to read this article and think about your retirement or at least long-term investment plan.
Some of our subscribers are using WATTS to manage their retirement accounts. We encourage you to think about the possibility of applying the same strategy to your retirement account management. For those of subscribers who are doing so, they are not pursuing a killing return with WATTS. What they ask for is just a few % higher than the average market return every year, reliably and consistently.
You can do the math yourself to figure out how much more money you would have when you retire if you can just earn 3% higher than the long-term average market return. Compounding will do the magic for your retirement. If you don't believe, see the following example.
Assume the average market return is 8% after all costs and you, by using WATTS to manage your retirement account can earn 11% on your investment. What's the difference after 30 years? You may think that 3% is no big deal.
Well, after 30 years, 8% return will make your initial $10,000 investment become $100,626. Not bad. Let's see what happen to your initial $10,000 if you can earn 11% on it. It's $228,922. No, it's not typo. For every $10,000 investment, you can earn $128,296 more for your retirement even if you only add 3% extra return on it.
We know this sounds like a sales pitch, but we still want to say it. Knowing and subscribing to Trend Watch could be your best investment decision in your whole life.


