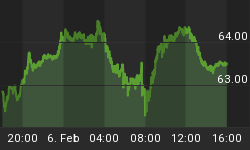
It was a very interesting week. The banks had started to lead higher some weeks back when it was considered a slam dunk that the fed would raise rates at the June meeting coming up next week. Then the market got hit with a negative surprise with the jobs report which came in roughly 130,000 jobs short. Smart money recognized that the rate hike was off the table for June and thus rates started to fall. The banks hit its long term down trend line and instead of breaking through it, it turned and headed south. Too many economic negatives to make a clean breakout which would have likely led to the Sp challenging the old highs at 2134. It was a real slap in the face to the financials and that carried over to the rest of the market as this week came to an end. A small down day yesterday followed by a big down day today. The banks leading the way lower with the other big headache in the market place, the biotechnology stocks. They too failed at their long term down trend line and are still firmly entrenched in a bear market. This sector has been lagging for quite some time and is showing nothing positive after giving a bit of hope a few weeks back. The failure at the trend line sharp and nasty. Not what you want to see for a sector that the bulls were hoping was trying to bottom. If you're bottoming you fail but hold close to the trend line area of resistance. No such luck here thus it's still a confirmed headache for the bulls. So while we did close above 2116 this week (2119) it was only by a few points which we know is not a confirmation. It failed from there and now we're back below by quite a bit. A very disappointing finish to a week that early on held a lot of promise for the bulls.

So now we ask ourselves, is the run over for the bulls? The answer is quite possibly not at all. There were and still are some negative divergences on the daily index charts and they may need a little more working off to the down side before the bulls try yet again. Today's failure should by no means make you bearish on this market. Yes, once again we failed at the 2116 level but sometimes it takes many tries before breaking through. There is hope for the bears when you see repeated failures but there isn't a lot of volume on the moves off the top that would confirm a new down trend has begun. No distribution whatsoever so you can't count the bulls out. They've taken a hit but they are far from dead. The oscillators are unwinding some and to me that's never a bad thing. It's always better to have them more unwound before trying to break out of a range. If the oscillators can unwind without too much in terms of price erosion then the bulls still have a good shot of taking out 2116 with force and then ultimately challenging 2134. Today should not be considered bearish at all. It should be taken for what it was. A pullback in an overall slight up trend that may, in time, take out the bears completely. On the bearish side, you have to like the fact that they once again defended a key resistance level but really nothing more. No sign of a continue down trend is in place yet. Maybe the bears can establish something more bearish but they haven't yet so keep an open mind and let the story be written before determining the outcome ahead of time.

The market hasn't gone anywhere in nearly two years and thus it's easy to predict the next move when the market gets near the top of the range. At least that's what many may believe. Rejection doesn't mean failure. It has been two long years to nowhere and many have given up on this market which in many ways is an advantage to the bulls as we are far from being complacent in terms of the bull bear spread. If complacency was prevalent then I'd be more on the side of the bears but because things are more neutral it's unwise to say we can't move up and out. We may never make the move but it won't because of complacency. it'll be more because of a dying economy here and abroad along with all the other problems I've gone over repeatedly. Negative long term divergences. Poor economies. Bad jobs report this past week. High Sp p/e along with declining earnings. That's enough in the real world to prevent a breakout. That said, it won't not happen because we're too complacent.

Please join us for a free 3 week trial at www.TheInformedTrader.com


