


Market Summary
Weekly losses for the most of the major equity indexes suggest that an aggressive post-election rally might be running out of steam. Other than a minuscule gain by the Dow, the other equity indexes snapped three-week winning streaks. For the week, the S&P 500 Index shed 1.0% and the Blue Chip-heavy Dow Jones Industrial gained only.01%. The Nasdaq was the biggest loser down 2.7% while the small cap Russell 2000 sank 2.45%. All four of the major indices remain within throwing distance of all-time highs, but upward momentum is dissipating.

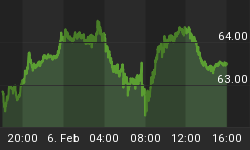
The chart below identifies one of the biggest warning signs against the stock market continuing higher in the near term. You can see that the Nasdaq stocks are lagging the other major equity indexes. This can be considered non confirmation of the current trend, especially considering tech stocks have been leading the market higher all year. In particular the FANG stocks (Facebook, Amazon, Netflix, and Google) have sold off lately. Tech stocks usually set the overall market direction, if this is still true the market is due for pullback unless the Nasdaq recovers.

As evidenced in the chart below, an unintended consequence of Trump's victory has been the surge in the U.S. dollar. Some market pundits believe that deficit spending under a Trump administration could drop the dollar lower, but when factoring in potential protectionist trade policies and the overall global deflationary environment, you could easily argue that the recent dollar move has the potential for a much bigger upside. The very sharp rise in real market-driven interest rates is the clear driver of the dollar at present. Also shown in the chart are gold and treasury bond prices falling after the dollar began its ascent. Higher interest rates and a stronger dollar are both are negative for precious metals and bond prices. Barring some unforeseen crisis, next year it is easy to see gold delivering a complete reversal of the rally we saw in the first half of 2016.

Market Outlook
All of the major equity indices have hit record highs following the presidential election, but now the market is due for a consolidation to absorb overbought conditions. Further upside gains will probably be limited ahead of the December 14th FOMC announcement with a 100% expectation of a hike, that should be a non-event. As reported by Ryan Vlastelica in a recent MarketWatch article, largely been obscured in the aftermath of Trump's underdog victory, which sparked the equity rally, a win by the Republican candidate had been widely seen as negative for markets. The President-elect was viewed as a wild card, lacking a track record in government and offering few or contradictory policy details. His temperament suggest a question mark more than a steady hand. "While the U.S. macroeconomic cycle may get a boost from the proposed fiscal stimulus, corporate tax reform and de-regulation, both the passage and efficacy of these measures are far from certain at this moment," J.P. Morgan wrote in a Nov. 30 note. "We think that, fundamentally, risks for equities in 2017 are higher compared to 2016. We expect an increased level of geopolitical risk and increased uncertainties related to the new U.S. administration." "This fearless stock market looks to be underestimating the possibility of President Trump rattling risk markets during his four-year term," wrote John Blank, chief equity strategist at Zacks Equity Research. "He remains unpredictable." The updated graph below displays third-quarter performance for the major asset classes. The biggest underperformers are asset classes that are expected to suffer from higher interest rates.

The CBOE Volatility Index (VIX) is known as the market's "fear gauge" because it tracks the expected volatility priced into short-term S&P 500 Index options. When stocks stumble, the uptick in volatility and the demand for index put options tends to drive up the price of options premiums and sends the VIX higher. As confirmed in the updated chart below, the volatility index bounced higher off support last week as the S&P 500 stalled out. Investors may be getting a little antsy ahead of the upcoming Fed meeting.

The American Association of Individual Investors (AAII) Sentiment Survey measures the percentage of individual investors who are bullish, bearish, and neutral on the stock market for the next six months; individuals are polled from the ranks of the AAII membership on a weekly basis. Bullish sentiment, expectations that stock prices will rise over the next six months, fell by 6.1 percentage points to 43.8%. The pullback follows last week's reading of 49.9%, which was the highest level recorded by our survey since January 1, 2015 (51.7%). Even with this week's drop, bullish sentiment remains above its historical average of 38.5% for a fourth consecutive week. Neutral sentiment, expectations that stock prices will stay essentially unchanged over the next six months, rebounded by 3.1 percentage points to 31.1%. The increase puts neutral sentiment about even with its historical average of 31.0%. Bearish sentiment, expectations that stock prices will fall over the next six months, rose 3.0 percentage points to 25.1%. Pessimism was last lower on August 17, 2016. The increase is not large enough to prevent pessimism from remaining below its historical average of 30.5% for a fourth consecutive week. This week's results follow a significant shift in sentiment. During the three-week period of November 2 through November 23, 2016, optimism rose by a cumulative 26.3 percentage points, neutral sentiment fell by a cumulative 14.0 percentage points and pessimism fell by a cumulative 12.2 percentage points. The rise in bullish sentiment was the 13th largest three-week increase in the survey's 29-year history.

The National Association of Active Investment Managers (NAAIM) Exposure Index represents the average exposure to US Equity markets reported by NAAIM members. The blue bars depict a two-week moving average of the NAAIM managers' responses. As the name indicates, the NAAIM Exposure Index provides insight into the actual adjustments active risk managers have made to client accounts over the past two weeks. The current survey result is for the week ending 11/30/2016. Third-quarter NAAIM exposure index averaged 80.32%. Last week the NAAIM exposure index was 86.56%, and the current week's exposure is 98.02%. Our recent comments are playing out as advertised where we said "...The NAAIM Exposure Index will probably trend higher leading up to the December FMOC meeting...The Trump rally continues unabated as investors rotate money out of bonds and other defensive sectors into shares of companies that are expected to benefit under a Trump administration..." Most probably, how investors interpret comments from the December 14th FOMC meeting will influence whether the NAAIM Exposure Index remains at elevated levels.

Trading Strategy
As reported in the most recent American Association of Individual Investor survey (AAII), support for the concept of the post-election ("Trump") rally borrowing gains from 2017 is indicated in the most recent survey. Optimism was both unusually low (a bullish sign) and unusually high (a bearish sign) in recent weeks. Though seemingly contradictory, the two signals may not be when the post-election rally is taken into account. The election's outcome remains front and center for many AAII members. Some are encouraged by possible changes President-elect Donald Trump could make, while others are uncertain or want to wait to see how his administration's policies and their impact on the market evolve. There are also individual investors who are pessimistic following the election. Beyond the election, the direction of interest rates, the pace of economic and earnings growth, and valuations are influencing individual investors' expectations for the stock market. Recent analysis is still valid where we stated "...The past few weeks investors having been selling off bonds, gold, utilities and other defensive sectors. As evidenced in the updated chart below, investors are rolling into financial, industrials and other sectors expected to benefit from Republican control of the presidency and both houses of Congress. Also, historically, November begins the best consecutive six-months for the stock market. There is still plenty of cash sitting on the sidelines and any price pullback should be considered a buying opportunity for stocks on your watch list..."

Feel free to contact me with questions,


