


Market Summary
The major equity indices closed mostly lower this past week as economic data came in mixed along with falling spending by the consumer. Inflation has been tepid but showed solid growth this past month as both Producer (PPI) and Consumer (CPI) prices rose moderately. Markets are on shaky ground and trading in a tight or coiling range recently. For the week, the S&P 500 Index fell 0.3% while the Blue Chip-heavy Dow Jones Industrial Average finished down 0.5%. The Nasdaq was the lone winner for the week finishing up 0.7% while the small caps Russell 2000 and Midcap 400 both fell a disappointing 1%. Smalls caps and the Dow industrials settled near their 50-day moving averages and a breach of these technical levels could signal a more significant pullback.

(Click to enlarge)
A standard chart that we use to help confirm the overall market trend is the Momentum Factor ETF (MTUM) chart. Momentum Factor ETF is an investment that seeks to track the investment results of an index composed of U.S. large- and mid-capitalization stocks exhibiting relatively higher price momentum. This type of momentum fund is considered a reliable proxy for the overall stock market trend. We prefer to use the Heikin-Ashi format to display the Momentum Factor ETF. Heikin-Ashi candlestick charts are designed to filter out volatility in an effort to better capture the true trend. Last week’s analysis played out as advertised when we said “…MTUM is overextended and don’t be surprised if we get a pause next week to absorb over the extremely overbought condition…” Stock prices are churning between buyers and sellers, but the path of least resistance is still higher as investors rotate from risk-off into riskier sectors.

(Click to enlarge)
In the updated chart below the DOW Transportation index ($TRAN) continues to diverge lower from the Dow Jones Industrial Average ($INDU). When the DOW Transports and Industrials don’t move in synch it is considered a technical sign of a weakening trend. You can see in the updated chart below how the transportation index is starting to drag down the Dow Industrials as we recently pointed out “… Expect the Industrial index to retrench if the Transports don’t catch up soon…”

(Click to enlarge)
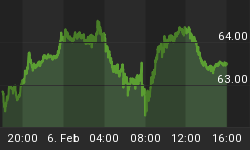
In the chart below the dollar booked a small weekly gain, according to FactSet data, its first weekly gain in five weeks and biggest since end of March. “Economic data came in slightly weaker than expected, but this does not impact expectations about a June rate hike,” said Win Thin, global head of emerging market currency strategy at Brown Brothers Harriman. Gold finished the week slightly higher with three straight winning sessions, a feat it had not achieved since mid-April, as the dollar drifted lower following slightly weaker-than-expected U.S. retail sales and inflation data. Treasury prices jumped sharply higher on Friday for the biggest weekly advance in a month, after weak inflation data and lukewarm consumer spending lowered expectations for two more Fed rate increases this year.

(Click to enlarge)
Market Outlook
Expectations are expanding for an improved second quarter on both data and consumer spending, which has supported equity markets near all-time highs. The white house has yet to detail tax reform and infrastructure buildout plans, but many market-watchers are expecting it to propel stock prices for the rest of 2017. This is the May option expiration week and according to Jeff Hirsch in the Almanac Trader, trading around May option expiration is mostly a mixed bag. Only the first day of the week has a solidly bullish bias over the past 35 years. Trading the rest of the week into Friday, and the following week has historically been choppy. DJIA has been down nineteen of the last thirty-five May expiration days with an average loss of 0.15%. The full-week has a bearish bias for DJIA and S&P 500 with records of 18 declines and 17 advances over the past 35 years. More recently, DJIA and S&P 500 have suffered declines in six of the past eight expiration weeks. The updated graph below indicates investors are trading “risk-on”, selling off defensive assets buying equities. The Nasdaq index remains the market leader pulling the other equity indices higher.

(Click to enlarge)
Put/Call Ratio is the ratio of trading volume of put options to call options. The Put/Call Ratio has long been viewed as an indicator of investor sentiment in the markets. Times where the number of traded call options outpaces the number of traded put options would signal a bullish sentiment, and vice versa. Technical traders have used the Put/Call Ratio for years as an indicator of the market. Most importantly, changes or swings in the ratio are seen as instances of great importance as this is commonly viewed as a change in the tide of overall market sentiment. Investors remain optimistic as the quarterly earnings season winds down. Traders are aggressively buying call options to bet on higher prices.

The CBOE Volatility Index (VIX) is known as the market’s “fear gauge” because it tracks the expected volatility priced into short-term S&P 500 Index options. When stocks stumble, the uptick in volatility and the demand for index put options tends to drive up the price of options premiums and sends the VIX higher. In the updated chart below the CBOE Volatility Index slipped below double digits for only the 10th time in history Monday as the fear gauge plummeted to a 24 year milestone at 9.77 after imploding by nearly 8% intra-day with little on the periphery to deter market participants from expecting anything other than the status quo. The VIX closed below 10 three consecutive days in a row. There have been only 11 days out of some 6900, going back almost 28 years, when we’ve had a sub-10 VIX. Current implied volatility is at a level that has been experienced only 0.22% of the time since 1990, and is about half its long term average. This is probably the strongest signal that investors have become complacent about the threat of falling stock prices. Conversely, some market watchers view this extreme complacency as a contra indicator of an impending price correction.

(Click to enlarge)
The American Association of Individual Investors (AAII) Sentiment Survey measures the percentage of individual investors who are bullish, bearish, and neutral on the stock market for the next six months; individuals are polled from the ranks of the AAII membership on a weekly basis. The current survey result is for the week ending 05/10/2017. The percentage of individual investors describing their short-term outlook for stock prices as "neutral" is at a six-month high, according to the latest AAII Sentiment Survey. Neutral sentiment, expectations that stock prices will stay essentially unchanged over the next six months, rose 5.1 percentage points to 37.1%. Neutral sentiment was last higher on November 2, 2016 (42.0%). The rise keeps neutral sentiment above its historical average of 31% for the seventh time in eight weeks. Optimism pulled back this week, while pessimism rose slightly. Bullish sentiment, expectations that stock prices will rise over the next six months, fell 5.3 percentage points to 32.7%. The drop keeps optimism below its historical average of 38.5% for 16 out of the last 17 weeks. Bearish sentiment, expectations that stock prices will fall over the next six months, is 0.3 percentage points higher at 30.2%. The historical average is 30.5%. At current levels, all three sentiment indicators are within their typical historical ranges. AAII members, in aggregate, are not significantly altering their market outlooks in reaction to the ongoing record highs for stocks prices. While some view the gains favorably, others fret about rising valuations. We continue to see President Trump and the potential impact of his administration's policies brought up in response to our weekly special questions—even when the questions have nothing to do with Washington politics. Also playing a role is the lack of volatility and concerns about the potential for a forthcoming drop in stock prices.

(Click to enlarge)
The National Association of Active Investment Managers (NAAIM) Exposure Index represents the average exposure to US Equity markets reported by NAAIM members. The blue bars depict a two-week moving average of the NAAIM managers’ responses. As the name indicates, the NAAIM Exposure Index provides insight into the actual adjustments active risk managers have made to client accounts over the past two weeks. The current survey result is for the week ending 05/10/2017. First-quarter NAAIM exposure index averaged 92.85%. Last week the NAAIM exposure index was 82.35 %, and the current week’s exposure is 92.95%. The NAAIM exposure rose last week. It appears money managers might be taking advantage of the stall in upward stock price movement to “buy the dip”. Absent an actual pullback, stock prices are pausing before the next move which presents an opportunity to catch the next big wave.

(Click to enlarge)
Trading Strategy
The bullish side of the market continues to be the path of least resistance and as long as support holds, we are still in a "buy the dip mode". If there was such a thing as a Trump Trade, it ended several months ago, and the new reason for bullishness has become plain and simple earnings growth, the best growth quarter in years for the S&P 500 companies. The updated graph below confirms investors are trading “risk-on” with all the S&P higher risk growth sectors Cyclicals, Technology and Industrials leading the way higher over the past month. The defensive sectors on the right side of the graph are faltering as traders rotate funds out of these equites into growth stocks.
By Gregory Clay for Safehaven.com


