


Market Summary
Friday marked the 20th record of the year for the S&P 500, surpassing the number of records set by the index in 2016. Double-digit gains in large technology names have been among Wall Street’s biggest catalysts this year. The Nasdaq, meanwhile, has rung up 35 record closes in 2017. For the week, the Dow gained 1.3%, the S&P 500 advanced 1.4%, and the Nasdaq booked a 2.1% gain. The small caps Russell 2000 was up 1.74% and Midcap 400 was the best gainer jumping 2.82%.

(Click to enlarge)
A standard chart that we use to help confirm the overall market trend is the Momentum Factor ETF (MTUM) chart. Momentum Factor ETF is an investment that seeks to track the investment results of an index composed of U.S. large- and mid-capitalization stocks exhibiting relatively higher price momentum. This type of momentum fund is considered a reliable proxy for the overall stock market trend. We prefer to use the Heikin-Ashi format to display the Momentum Factor ETF. Heikin-Ashi candlestick charts are designed to filter out volatility in an effort to better capture the true trend. In the updated chart below you can the MTUM ETF confirmed a breakout into a new uptrend. This move can easily keep on going because the Momentum Factor ETF is just now reaching the overbought level.

(Click to enlarge)
In the updated chart below the DOW Transportation index ($TRAN) jumped higher to start converging with the Dow Jones Industrial Average ($INDU). Just like when the DOW Transports and Industrials don’t move in synch is considered a technical sign of a weakening trend, when these indexes synch up it supports the current trend.

(Click to enlarge)
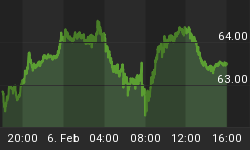
The dollar weakness since the start of the year took a lot of strategists by surprise as the consensus outlook for the buck had been bullish. In the updated chart below the dollar pretty much ended the week where it started. Gold on Friday closed at its highest level of the month, lifting prices for a third week in a row as a fresh round of geopolitical jitters offset expectations for higher U.S. interest rates, which would otherwise be bearish for gold prices. Treasury yields retreated on Friday as a batch of economic reports came in mixed ahead of the Memorial Day holiday, but a slight yield gain on the week was enough to halt a weekly string of declines for government bonds at two. Prices move in the opposite direction of yields; one basis point is one hundredth of a percentage point. Despite the slight weekly rise in yields, government bonds have mostly drawn bidders, keeping yields in range, even as the Federal Reserve looks set to lift interest rates in June.

(Click to enlarge)
Market Outlook
Jeff Hirsh in the Stock Traders’ Almanac wrote about how the days after Memorial Day have been rather bullish. In what used to be the “May/June Disaster area” the S&P was down 15 of 20 Mays from 1965 to 1984. Then May was the best month from 1985 to 1997. Some of this bullishness after Memorial Day can be attributed to the strength of the first two days of June (like this year). In recent years, the Friday before Memorial has become getaway day on The Street and volume is often diminished and trading uninspired. NASDAQ exhibits a similar pattern to S&P 500 over the same time periods. The updated graph below indicates investors converting back to risk-on trading by overindulging in high-flying tech stocks. Other equity indices are also coming on strong outperforming risk-off assets like gold and bonds. This is another strong indicator of higher near term stock prices.

(Click to enlarge)
The CBOE Volatility Index (VIX) is known as the market’s “fear gauge” because it tracks the expected volatility priced into short-term S&P 500 Index options. When stocks stumble, the uptick in volatility and the demand for index put options tends to drive up the price of options premiums and sends the VIX higher. The CBOE Volatility index exploded a few weeks ago during the brief stock market crash. In the updated chart below the VIX sank back to extremely low levels as the major equity indexes achieved new all-time highs.

(Click to enlarge)
The American Association of Individual Investors (AAII) Sentiment Survey measures the percentage of individual investors who are bullish, bearish, and neutral on the stock market for the next six months; individuals are polled from the ranks of the AAII membership on a weekly basis. The current survey result is for the week ending 05/25/2017. Nearly one out of three individual investors expects stocks to rebound over the short-term as optimism rebounded strongly in the latest AAII Sentiment Survey. At the same time, both neutral sentiment and pessimism pulled back. Bullish sentiment, expectations that stock prices will rise over the next six months, jumped 9.0 percentage points to 32.9%. The rise puts optimism back into its typical range. The rise in optimism follows what had been an unusually low level of bullish sentiment and implies some reversion back toward the average. It also occurred as the S&P 500 index set new record highs. The jump is not large enough, however, to prevent bullish sentiment from staying below its historical average of 38.5% for the 18th time out of the last 19 weeks. Neutral sentiment, expectations that stock prices will stay essentially unchanged over the next six months, fell 4.8 percentage points to 37.1%. Neutral sentiment is above its historical average of 31% for the fourth consecutive week and the ninth time in 10 weeks. Bearish sentiment, expectations that stock prices will fall over the next six months, pulled back by 4.3 percentage points to 30.0%. The decline puts pessimism slightly below its historical average of 30.5% for the third time in four weeks. This week's readings are very close to the levels recorded two weeks ago.

(Click to enlarge)
The National Association of Active Investment Managers (NAAIM) Exposure Index represents the average exposure to US Equity markets reported by NAAIM members. The blue bars depict a two-week moving average of the NAAIM managers’ responses. As the name indicates, the NAAIM Exposure Index provides insight into the actual adjustments active risk managers have made to client accounts over the past two weeks. The current survey result is for the week ending 05/25/2017. First-quarter NAAIM exposure index averaged 92.85%. Last week the NAAIM exposure index was 92.13 %, and the current week’s exposure is 97.16%. Recently we have been saying “…It appears money managers might be taking advantage of the stall in upward stock price movement to “buy the dip”. Absent an actual pullback, stock prices are pausing before the next move which presents an opportunity to catch the next big wave…investors already stepping in to buy on Friday after Wednesday’s big dip…” Don’t be surprised if money managers push the NAAIM index even higher.
Trading Strategy
Though some individual investors are encouraged by the recent bullish surge, others fret about valuations or fear that a significant drop is forthcoming. Beyond the current level of stock prices, President Donald Trump is having a big influence on many investors’ attitudes. Also playing roles are this year’s lack of volatility and the possibility of a significant international event occurring. This week’s special question asked American Association of Individual Investor (AAII) members how first-quarter earnings have influenced their outlook for stock prices. Nearly two out of five respondents (39%) said the quarterly profit reports had no or only a minimal impact on their outlook. Many of these respondents said they are more focused on politics, though others said the earnings reports confirm their outlook or that they take a long-term view and are not influenced by one quarter’s results. Nearly 33% of respondents credited first-quarter earnings for making or keeping them optimistic about the prospects for stocks. Some of these respondents pointed to corporate profits as a sign of growth. Slightly more than 13% described the market as fairly valued or overvalued and don’t think earnings were good enough to reduce valuations. The updated graph below shows Technology sector stocks as the leading performer. This should be considered a strong bullish signal for stocks because tech stocks have established market direction for over a year. With the S&P ETF technology sector sprinting higher it is reasonable to expect the overall market to follow.

(Click to enlarge)
By Gregory Clay for Safehaven.com


