


The good news is:
• The small caps have been stronger than the blue chips during therecent period of weakness.
Short term
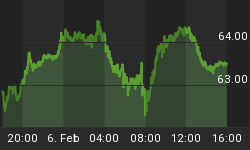
The chart below covers the past year with dashed vertical lines on the 1st trading day of each month. The NASDAQ composite (OTC) is shown in red and momentum of NASDAQ downside volume (OTC DV) is shown in blue. Direction, not level, of the indicator is most important. As of Friday's close the indicator was heading downward.

It is possible that Friday was the bottom because the ratio of upside to downside volume was extreme. On the NASDAQ there were 2,067,770 shares traded of issues that declined in price and only 244,633,130 shares traded of issues that advanced in price a ratio of about 8.5 to 1. Total volume hit its highest level for the year so far on the NYSE and second highest on the NASDAQ.
The chart below covers the past 3 months showing the NASDAQ daily up/down volume ratio in blue and the OTC in red. I have drawn a horizontal line at last Friday's level which has only been reached twice before in the past 3 months. Each of the previous two occurrences were at or near a short term low.

The NASDAQ new high indicator ( OTC NH) is a 10% trend (19 day EMA) of NASDAQ new highs. The chart below covers the period from late August through last Friday. The OTC is shown in red and OTC NH is shown in green.
The indicator turned upward with Thursday's rally and continued moving upward on Friday even though Friday was down from the open. In early December the indicator continued moving upward for 2 days after the market turned downward so Monday will be important for this indicator.
As of Friday the value of the indicator was 132 so more than 132 new highs will move the indicator upward while less than 132 will move the indicator downward.

Intermediate term
The secondaries lead both up and down.
The chart below shows the OTC in red and a FastTrack relative strength indicator called Accutrack (AT) in black. AT is comparing the Russell 2000 (R2K) and the S&P 500 (SPX). When the indicator rises the R2K is outperforming the SPX.

While the market fell last week, AT rose sharply indicating the R2K held up better than the SPX.
Seasonality
Options expire on the 3rd Friday of each month. For about 10 years beginning in the mid 1980's perceived higher levels of volatility were blamed on options expiration. The tables below show the week after the 3rd Friday of January during the 2nd year of the Presidential cycle. The tables cover years 1966 - 2002 for the OTC and 1930 - 2002 for the SPX. There are summaries for all years 1963 - 2005 for the OTC and 1928 - 2005 for the SPX. Options were not actively traded before the early 1980's.
The week following to the 3rd Friday has on average been a little weak. Since the mid 1980's the market has been a little weaker than it was before during the week following options expiration.
Report for the week after options expiration during January.
The number following the year is its position in the presidential cycle.
Daily returns from Monday to Friday after option expiration.
| OTC Presidential Year 2 | ||||||
| Year | Mon | Tue | Wed | Thur | Fri | Totals |
| 1966-2 | 0.12% | -0.07% | 0.27% | -0.08% | 0.02% | 0.25% |
| 1970-2 | -0.93% | -0.91% | 0.00% | 0.31% | 0.18% | -1.36% |
| 1974-2 | -0.88% | 0.86% | 0.49% | -0.16% | -0.22% | 0.09% |
| 1978-2 | -0.29% | 0.20% | 0.33% | -0.34% | 0.09% | -0.01% |
| 1982-2 | -1.24% | -0.06% | 0.09% | 1.44% | 1.17% | 1.39% |
| 1986-2 | -0.37% | -0.30% | -0.54% | -0.02% | 0.66% | -0.56% |
| Avg | -0.74% | -0.04% | 0.09% | 0.25% | 0.38% | -0.09% |
| 1990-2 | -2.03% | -0.38% | -1.08% | -0.10% | -0.92% | -4.50% |
| 1994-2 | -0.46% | -0.54% | 0.31% | 0.52% | 0.46% | 0.29% |
| 1998-2 | -0.91% | 1.74% | -0.14% | -0.72% | -0.04% | -0.07% |
| 2002-2 | 0.32% | -2.48% | 2.12% | 1.05% | -0.25% | 0.76% |
| Avg | -0.77% | -0.41% | 0.30% | 0.19% | -0.19% | -0.88% |
| OTC summary for Presidential year 1 1966 - 2002 | ||||||
| Avg | -0.67% | -0.19% | 0.20% | 0.19% | 0.11% | -0.37% |
| Win% | 20% | 30% | 67% | 40% | 60% | 50% |
| OTC summary for all years 1963 - 2005 | ||||||
| Avg | -0.16% | 0.04% | 0.08% | 0.15% | 0.07% | 0.19% |
| Win% | 55% | 44% | 50% | 48% | 69% | 60% |
| SPX Presidential Year 2 | ||||||
| Year | Mon | Tue | Wed | Thur | Fri | Totals |
| 1930-2 | 0.61% | 0.51% | 0.09% | 0.97% | 0.00% | 2.18% |
| 1934-2 | -0.27% | 1.28% | 0.63% | 0.00% | 0.00% | 1.64% |
| 1938-2 | -0.09% | -1.58% | -3.83% | -1.39% | 0.00% | -6.89% |
| 1942-2 | 0.45% | -0.22% | -1.45% | 0.00% | 0.00% | -1.23% |
| 1946-2 | -1.99% | 0.68% | 1.18% | 0.28% | 0.00% | 0.14% |
| Avg | -0.26% | 0.13% | -0.68% | -0.05% | 0.00% | -0.83% |
| 1950-2 | -0.12% | -0.35% | -0.71% | -0.06% | 0.00% | -1.24% |
| 1954-2 | 0.31% | 0.62% | -0.31% | 0.04% | 0.23% | 0.89% |
| 1958-2 | 0.61% | -0.12% | -0.24% | 0.39% | 0.85% | 1.48% |
| 1962-2 | 0.09% | -0.76% | 0.16% | -0.07% | -0.32% | -0.90% |
| 1966-2 | 0.26% | 0.15% | -0.16% | -0.03% | -0.38% | -0.17% |
| Avg | 0.23% | -0.09% | -0.25% | 0.05% | 0.09% | 0.01% |
| 1970-2 | -1.40% | 0.20% | 0.09% | 0.04% | -0.98% | -2.04% |
| 1974-2 | -0.17% | 1.21% | 0.54% | -0.26% | -0.20% | 1.12% |
| 1978-2 | -0.72% | 0.01% | 0.16% | -0.91% | 0.00% | -1.46% |
| 1982-2 | 0.03% | -0.19% | 0.48% | 2.75% | 1.24% | 4.30% |
| 1986-2 | -0.43% | -0.84% | -1.12% | 0.37% | 1.07% | -0.95% |
| Avg | -0.54% | 0.08% | 0.03% | 0.40% | 0.28% | 0.20% |
| 1990-2 | -2.59% | 0.37% | -0.41% | -1.27% | -0.09% | -3.97% |
| 1994-2 | -0.58% | -0.22% | 0.48% | 0.81% | 0.35% | 0.84% |
| 1998-2 | -0.07% | 1.78% | -0.80% | -0.80% | -0.57% | -0.45% |
| 2002-2 | -0.02% | -0.73% | 0.79% | 0.35% | 0.10% | 0.49% |
| Avg | -0.81% | 0.30% | 0.02% | -0.22% | -0.05% | -0.77% |
| SPX summary for Presidential Year 2 1930 - 2002 | ||||||
| Avg | -0.32% | 0.09% | -0.23% | 0.07% | 0.11% | -0.33% |
| Win% | 37% | 53% | 53% | 53% | 50% | 47% |
| SPX summary for all years 1928 - 2005 | ||||||
| Avg | -0.23% | 0.10% | 0.01% | 0.08% | 0.06% | -0.01% |
| Win% | 41% | 58% | 51% | 53% | 58% | 59% |
Conclusion
Friday looked like a selling climax so it is unlikely there will be much more movement to the downside.
I expect the major indices to be higher on Friday January 27 than they were on Friday January 20.
This report is free to anyone who wants it, so please tell your friends. They can sign up at: http://alphaim.net/signup.html. If it is not for you, reply with REMOVE in the subject line.


