


Moneyization: The global financial phenomenon of individuals and businesses moving their funds to monies in which they have the highest confidence, or money in which they have a higher store of faith.
Or, Waiting Around for Nothing
Around the investment world this week, many sat waiting for nothing to happen. Listening to the business media one might have thought some event of importance was occurring these last days of June. The Federal Reserve's meeting will not change today's world. Markets will react to the FOMC announcement, though no reasons exists for that reaction.
Conventional wisdom is that the Federal Reserve, and some other central banks, are suddenly inflation hawks. They are now believed to be determined to keep the evil monetary dragon from destroying "paper" money's purchasing power. All that fantasy thinking would be fine if the Federal Reserve's actions this week had any influence on today's or the next day's inflation.
Somehow a widespread belief has developed that a technologically advanced "inflation machine" sits in the basement of the Federal Reserve. On the front is a big dial labeled "monetary policy." After the FOMC meets, Chairman Bernanke goes to that basement. He faces the machine. Taking that big dial in his hand he twists it ever so slightly, about 25 basis points, and smiles. Around the nation the next morning, according to this dream fantasy, inflation will slowly creep down.
Due to the really great technology of this magic machine, a year from now, according to the faithful, inflation will be so low and life so slow that the Federal Reserve, and other central banks around the world, will be able to lower interest rates. Paper equities will scream upward in price. The hedge fund managers will be saved. All will be well. Horse droppings! Today's monetary policy has nothing to do with today's inflation rate.
Graph one, below, is a plot of the ten-year compound rate of inflation in the U.S., using the full CPI not the manipulated measure. That plot is the solid line, and uses the right axis. The red triangles, using the left axis, are the ten-year compound rate of increase in the U.S. money supply, measured by M-2. As is readily apparent, the plotted lines match up fairly well. A strong correlation exists between the ten-year compound rate of growth of the money supply and the ten-year compound rate of change of the inflation rate. Note that the money supply plot extends further out than the inflation rate. The reason for that portrayal is that changes in today's money supply influence tomorrow's inflation rate. The money supply plot is advanced sixty months.
That last plot for money supply growth, which is today's, will impact tomorrow's inflation rate in a few years. For that reason, whatever the FOMC does this week will have no, repeat no, impact on today's inflation rate.

The inflation rate for the next few years has already been determined by the mistakes of the FOMC in the past. The trend for U.S. inflation is up, meaning that the trend for your dollars' purchasing power is down. That is one of the reasons for owning Gold.
Graph two, which can be found below, portrays the year-to-year change in the U.S. CPI, solid line using right axis, and CPI Less Food & Energy, using triangles and left axis. All the attention is focused on that CPI-F&E, which has clearly broken out to the upside. That upside breakout suggests that higher inflation lies ahead, as we learned from looking at the first graph.


Note the interesting divergence in the latest plot, with CPI-F&E moving up while other measure declines. Owners Equivalent Rent(OER) is the measure of housing costs, and it is a large part of the CPI-F&E. With housing sales sliding, rents are moving up. Statisticians at the U.S. government now says housing costs are rising. Where have these statistical clowns been for the last few years? One other interesting note is that the way energy costs are used to calculate OER, the rising cost of energy to heat and cool has actually reduced the cost of housing and, therefore, reduced the inflation rate, according to government statisticians. Presumably, the Federal Reserve will soon have to use the CPI Less Food, Energy & Housing.
As the third graph portrays, this inflation problem is evident in other nations. Canada's consumer prices, shown in this graph, are experiencing the same inflationary developments. In that graph are plotted the year-to-year changes in the annual average consumer price index with the exception of the 2006 plot. That last plotted point is the year-to-year change for the month of May 2006. That approach then gives the picture of the marginal rate of inflation versus the average rate of inflation. The Canadian inflation rate, as shown in that graph, has clearly moved to a higher trading range, and is too likely to breakout to the upside. Most important is understanding implications of these higher rates of inflation.
Inflation is the destruction of purchasing power that occurs when governments allow too much money to be created. Inflation is not caused by higher oil prices. Higher oil prices are a consequence of the inflation process. Oil prices are higher because too many dollars have been created over the years, allowing dollar prices to be bid up. Oil prices are not at $70+ because of Chinese demand or SUVs. If the quantity of dollars in the world were half the current amount, the price of oil could not be bid to $70+ because not enough dollars would exist to allow that to happen.
Inflation is the creation of money which pushes down the value, or "price" of that money. The world today has a glut of dollars that have been created over the years to sustain the Technology Stock Bubble, the Housing/Mortgage Bubble, and the Hedge Fund Mania. With their bathtubs now full of dollars, consumers and foreign countries are allowing that continuing flow of dollars to slosh out into the markets for goods, like oil. Those excess dollars are now pushing up the dollar price of goods and services around the world.
The implications of rising inflation, or falling purchasing power for paper money, are two in number. First, the central banks, most importantly the Federal Reserve, will "over shoot" as the Street likes to call it. Second, the falling purchasing power and the recession from higher rates will push down the value of both American dollars, as recessionary forces overwhelm interest rate factors.
We learned from the discussion of the first graph that inflation, particularly in the U.S., now has an embedded upward trend. The Federal Reserve, driving while looking in the rearview mirror, will see nothing but a rising inflationary trend. While "pauses" will come and go, the trend is for higher rates that will create economic problems. Housing is already headed down. Forgotten is what happens on Main Street. As housing activity slows, sales and construction businesses lay off workers. Businesses are closed. Carpets are not sold. Washing machine salespersons lose their jobs. A real Main Street event takes place. Turning interest rates back down a quarter of a point next "March" will not reverse the process.
Higher inflation is going to lead to higher interest rates in the U.S., and, therefore, higher rates in other countries. At the end of 2007 interest rates will be higher not lower. Economic activity in the U.S. will be sliding into what will look like an abyss. Tax revenues will be declining as unemployment creeps upward. If foreign investors do not buy more U.S. debt the whole situation will become worse than expected. With a near collapsing U.S. economy will come a near collapsing U.S. dollar. That long-term resistance line on the dollar index, which is of course nonsense, will be violated and a traumatic experience will develop in the foreign exchange markets.
Connected to the health of that U.S. economy and dollar is the Canadian economy. By the end of 2007 Canada will understand well the meaning of a really big U.S. economic problem. That brings us to the Canadian dollar. To better understand the situation, look at a map. Canada has water on two sides, ice on one side, and the U.S. on the other. The Canadian dollar is surrounded by an environment that has no interest in owning it. No other investors in the world really want the Canadian dollar. Canadians are the demand for Canadian dollar. Canadian dollar is a long term sell cause no long term buyers other than Canadians exist. The same would be true for a Texas "peso" or a Californian "franc."
In this process of moving to higher interest rates, the value of paper equities will be damaged beyond most expectations. As graph four portrays, below, the NASDAQ Composite Index broke the fantasy support level at 2180 and has only hope of pausing at 2050. After that, hope will again rise at 1920 before breaking down completely. The rally in the equity markets of the past few years was created by the central banks lowering interest rates. That interest rate support is now gone. The bear is hungry from this forced hibernation, and she will have to be fed.

2006 will mark the resumption of the bear market in paper equities on a global basis. Financial "optimism" has reached the levels of 2000. Mergers and acquisitions, according to Association for Corporate Growth and Thomson Financial, in 2006 will break the record set in the year 2000. That year was the last major top in the paper equity markets. $100 billion of M&A have been announced in the past week. Unbelievable hunger for Chinese equities by institutions is another mark of financial frenzy often seen at historical peaks in equities. Look at all the exchanges being bought, sold and prepared for listing.
Speculators in Chinese securities and those of the developing markets will be punished unmercifully. Locals were more than willing to sell paper stocks to the foreign funds. When the funds try to unload those foreign securities, the telephones will go unanswered. Electronic market screens will show an absence of bids. Buying of foreign securities has always risen to an extreme at the end of bull markets when speculators seek out the last sources of return. Afterwards, they learn no one is there to buy them back. Losses to be experienced in these securities, particular Chinese equities, will be a major surprise and shock.
Paper equities face a rather dismal future. That future beholds a world good for owners of Gold. Some have called recent events the end of the bull market in Gold. However, Gold has not been in a bull market. Gold is in a super cycle to correct the economic and financial events of the past 20 years. Gold at US$700+ was the completion of the first of five waves, and was brought about by the frenzied buying of the Hedge Fund Mania. This summer Gold is experiencing the end of the second wave with the purging of the hedge fund devils. The third wave is beginning to develop, and investors should be taking positions in Gold, and Silver. 1,350 is a good number for both the future price of US$Gold and the support level for the NASDAQ Composite Index.

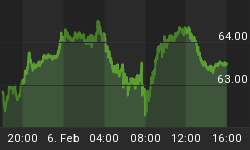
US$Gold, as shown in the above chart, is at prices with characteristics rarely seen. This summer's low price, created by the purging of the hedge funds, is a true bargain. Only twice before in the past year have US$Gold prices been this oversold. Investors that have previously missed opportunities to purchase Gold should be doing so at this time. While the "market strategists" on the Street are still talking about what the FOMC did or did not do, or did or did not say, move onto the money in which the world is now denominating its wealth, Gold.

Canadian $Gold, as shown in the above chart, is also providing an investment opportunity for Canadian-based investors. The entire hype from the recent hedge fund mania has been removed from the price of Gold. The Canadian dollar has served as a proxy for commodity prices during the recent run in those markets, and is at a level where profits should be captured. Those profits should be reinvested in Gold.


