


The good news is:
• Next week, the second week in July, is seasonally the strongest week of the month.
Short term
The new low indicator is a 10% trend (19 day EMA) of new lows plotted on an inverted Y axis (up is good). Direction is most important, but level has some significance. Risk is low when the indicator is moving upward and at a low level. For the NASDAQ low level may be defined as less than 40 on the indicator (10% trend) and less than 70 as a raw numerical value. When the indicator turns upward from a low it is prudent to wait for at least 5 consecutive up days before considering the market "safe".
The chart below shows the NASDAQ composite (OTC) in red and new low indicator calculated from NASDAQ new lows in blue. As of Friday's close the indicator completed 6 consecutive up days, but flattened on Friday. There were 79 new lows on Friday and the value of the indicator is 79, an uncomfortably high level. The next few days will be critical, if there are fewer than 79 new lows the indicator will move upward suggesting the low in June was the bottom.

Intermediate term
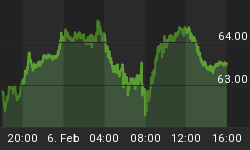
The chart below shows the Russell 2000 (R2K) in red and an indicator showing the ratio of new highs to new lows (NH / (NH + NL)) of the component issues of the R2K. For this chart new highs and new lows were calculated on a trailing 6 week basis rather than a trailing 52 week basis as reported by the exchanges.
This indicator has been changing direction every 2-3 weeks and prices have been following; the indicator just turned downward.

Seasonality
Next week is the week prior to the 2nd Friday of July during the 2nd year of the Presidential Cycle.
The tables below show daily returns for the OTC from 1966 - 2002 and S&P 500 (SPX) from 1930 - 2002 during the 2nd year of the Presidential Cycle. There are summaries for both the 2nd year of the Presidential Cycle and all years combined beginning with 1963 for the OTC and 1928 for the SPX.
During most years this period has been pretty strong, especially for the blue chips, however, gains for the OTC during the 2nd year of the Presidential Cycle have been modest.
Report for the week prior to the 2nd Friday in July
The number following the year is the position in the presidential cycle.
Daily returns from Monday to 2nd Friday.
| OTC Presidential Year 2 | ||||||
| Year | Mon | Tue | Wed | Thur | Fri | Totals |
| 1966-2 | 0.00% | 0.30% | -0.09% | 0.64% | 0.60% | 1.45% |
| 1970-2 | 0.55% | -0.48% | 1.04% | 1.80% | 1.93% | 4.84% |
| 1974-2 | -3.55% | -0.52% | -1.09% | -0.24% | 2.84% | -2.56% |
| 1978-2 | 0.17% | 0.38% | 0.38% | 0.12% | 0.95% | 2.00% |
| 1982-2 | 0.00% | -0.49% | -0.67% | -0.76% | 0.76% | -1.16% |
| 1986-2 | -1.72% | -1.59% | 0.27% | 0.49% | -0.14% | -2.68% |
| Avg | -1.14% | -0.54% | -0.02% | 0.28% | 1.27% | 0.09% |
| 1990-2 | 0.25% | -0.15% | 0.64% | 0.70% | 0.27% | 1.71% |
| 1994-2 | 0.00% | -0.46% | -0.37% | 0.79% | 0.13% | 0.09% |
| 1998-2 | 1.16% | 0.15% | 1.33% | 0.31% | 0.41% | 3.35% |
| 2002-2 | -2.95% | -1.74% | -2.54% | 2.11% | -0.07% | -5.19% |
| Avg | -0.51% | -0.55% | -0.24% | 0.98% | 0.19% | -0.01% |
| OTC summary for Presidential Year 2 1966 - 2002 | ||||||
| Avg | -0.87% | -0.46% | -0.11% | 0.60% | 0.77% | 0.18% |
| Win% | 57% | 30% | 50% | 80% | 80% | 60% |
| OTC summary for all years 1963 - 2005 | ||||||
| Avg | 0.03% | -0.13% | 0.21% | 0.25% | 0.44% | 0.79% |
| Win% | 70% | 47% | 57% | 65% | 77% | 65% |
| SPX Presidential Year 2 | ||||||
| Year | Mon | Tue | Wed | Thur | Fri | Totals |
| 1930-2 | 2.05% | -0.19% | 0.75% | 0.47% | 0.88% | 3.96% |
| 1934-2 | -0.10% | 0.61% | 0.50% | -0.80% | 0.20% | 0.41% |
| 1938-2 | 0.00% | -1.32% | 1.34% | -0.41% | -1.65% | -2.05% |
| 1942-2 | 1.07% | -0.23% | 2.47% | 1.03% | -0.11% | 4.22% |
| 1946-2 | -0.38% | 0.54% | 0.16% | -0.54% | -0.65% | -0.87% |
| Avg | 0.66% | -0.12% | 1.04% | -0.05% | -0.27% | 1.14% |
| 1950-2 | -0.45% | -1.53% | -2.60% | -1.07% | 1.08% | -4.57% |
| 1954-2 | 0.00% | 1.12% | 0.07% | 0.00% | 0.67% | 1.85% |
| 1958-2 | -1.27% | -0.07% | 0.31% | 0.66% | 0.48% | 0.12% |
| 1962-2 | 0.68% | 1.15% | 0.93% | 0.52% | -0.34% | 2.93% |
| 1966-2 | 0.00% | 0.25% | 1.44% | 0.37% | 0.26% | 2.32% |
| Avg | -0.35% | 0.18% | 0.03% | 0.12% | 0.43% | 0.53% |
| 1970-2 | -0.12% | -0.08% | 1.09% | 1.48% | 1.77% | 4.13% |
| 1974-2 | -3.07% | 0.48% | -1.83% | -0.13% | 4.08% | -0.46% |
| 1978-2 | 0.40% | 0.69% | 0.32% | 0.01% | 1.38% | 2.81% |
| 1982-2 | 0.00% | -0.33% | -0.07% | 0.29% | 1.21% | 1.10% |
| 1986-2 | -1.70% | -1.87% | 0.58% | 0.45% | 0.12% | -2.41% |
| Avg | -1.12% | -0.22% | 0.02% | 0.42% | 1.71% | 1.03% |
| 1990-2 | 0.31% | -0.84% | 1.33% | 1.17% | 0.51% | 2.47% |
| 1994-2 | 0.00% | 0.04% | -0.05% | 0.50% | 0.26% | 0.75% |
| 1998-2 | 0.08% | 1.06% | -0.24% | 0.78% | 0.23% | 1.91% |
| 2002-2 | -1.22% | -2.47% | -3.40% | 0.75% | -0.64% | -6.98% |
| Avg | -0.28% | -0.55% | -0.59% | 0.80% | 0.09% | -0.46% |
| SPX summary for Presidential Year 2 1930 - 2002 | ||||||
| Avg | -0.27% | -0.16% | 0.16% | 0.31% | 0.51% | 0.61% |
| Win% | 43% | 47% | 68% | 72% | 74% | 68% |
| SPX summary for all years 1928 - 2005 | ||||||
| Avg | 0.04% | -0.08% | 0.20% | 0.02% | 0.24% | 0.41% |
| Win% | 59% | 43% | 58% | 57% | 64% | 62% |
Conclusion
Some of the indicators suggest the market has entered a down cycle that will last about two weeks, but next weeks seasonal strength should moderate that decline.
I expect the major indices to be lower on Friday July 14 than they were on Friday July 7.
This report is free to anyone who wants it, so please tell your friends. They can sign up at: http://alphaim.net/signup.html. If it is not for you, reply with REMOVE in the subject line.
Gordon Harms produces a Power Point for our local timing group meetings, you can get a copy of that at: http://www.stockmarket-ta.com/. Our timing group meets on the 1st Wednesday of the month. If you are lucky enough to be in Minnesota during that time this summer you are welcome to attend.


