


The good news is:
• Volume for the components for some of the major indices have been increasing. This could lead to a washout and a tradable bottom.
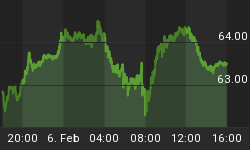
Short term
In the 8 trading days since the rally high that ended on the 1st trading day of July all of the major indices have all declined including:
Dow Jones Industrial Average 4.4%
S&P 500 (SPX) 3.4%
NASDAQ composite (OTC) 7.0%
S&P Mid cap 5.6%
Russell 2000 (R2K) 6.8%
Wilshire 5000 4.0%
Unfortunately there is no divergence in the indicators or anything I can see that would suggest a change of trend. Most of the indices are slightly above their mid-June lows and those levels might offer a little support, however, there is no reason to be optimistic about that support holding.
Intermediate term
Volume usually increases while prices are rising and declines while prices are falling and signals have been derived from this phenomenon. There are caveats of course, but volume patterns help round out our perspective.
The chart below covers the past year with grey dashed vertical lines drawn on the 1st trading day of each month and a red dashed vertical line drawn on the 1st trading day of the year. The OTC is shown in blue and an indicator showing momentum of NASDAQ total volume shown in red and green. The red dashed horizontal lines are the points where a sell signal is generated when the indicator declines from above to below the line and the green horizontal lines are the points where a buy signal is generated when the indicator rises from below to above the line. The indicator is shown in green when it is on a buy and red when it is on a sell.
You can see some of the problems with this indicator in the chart. Volume rose quickly last September as the market was nearing its final decline generating a premature buy signal. A sell was generated last December when there was a seasonally induced lull in volume. For now the indicator is low and falling.

The chart below is presented to explain the good news statement. It covers the period from the 1st of the year showing the SPX in red and a volume indicator similar the one shown above, but calculated from the component issues of the SPX. The indicator shows that during the past week volume of the SPX components has increased sharply. Perhaps we are nearing a washout.

Seasonality
Next week is the week prior to options expiration Friday in July during the 2nd year of the Presidential Cycle.
The tables below show daily returns for the OTC from 1966 - 2002 and S&P 500 (SPX) from 1930 - 2002 during the 2nd year of the Presidential Cycle. There are summaries for both the 2nd year of the Presidential Cycle and all years combined beginning with 1963 for the OTC and 1928 for the SPX.
Last week was, on average, the best week of the month.
Next week is, on average, the worst week of the month.
The number following the year is the position in the presidential cycle.
Daily returns from Monday to the 3rd Friday of July
| OTC Presidential Year 2 | ||||||
| Year | Mon | Tue | Wed | Thur | Fri | Totals |
| 1966-2 | 0.67% | -0.49% | -0.12% | -0.09% | 0.87% | 0.84% |
| 1970-2 | 0.33% | -0.68% | -0.80% | 0.24% | 0.83% | -0.08% |
| 1974-2 | 0.49% | -0.49% | 1.51% | 0.14% | 0.81% | 2.46% |
| 1978-2 | 0.64% | -0.22% | 0.58% | 0.77% | -0.12% | 1.65% |
| 1982-2 | 0.46% | 0.30% | -0.08% | 0.24% | 0.34% | 1.25% |
| 1986-2 | -0.42% | 0.11% | -0.01% | -0.29% | 0.29% | -0.32% |
| Avg | 0.30% | -0.20% | 0.24% | 0.22% | 0.43% | 0.99% |
| 1990-2 | 0.25% | -1.09% | -0.79% | -0.58% | -0.63% | -2.84% |
| 1994-2 | -0.09% | 0.39% | 1.38% | 0.31% | -0.03% | 1.96% |
| 1998-2 | 0.27% | -1.75% | -0.47% | -1.76% | -0.22% | -3.92% |
| 2002-2 | 0.66% | -0.53% | 1.60% | -2.88% | -2.79% | -3.94% |
| Avg | 0.27% | -0.74% | 0.43% | -1.23% | -0.92% | -2.18% |
| OTC sumamry for Presidential year 2 1966 - 2002 | ||||||
| Avg | 0.33% | -0.45% | 0.28% | -0.39% | -0.06% | -0.29% |
| Win% | 80% | 30% | 40% | 50% | 50% | 50% |
| OTC sumamry for all years 1963 - 2005 | ||||||
| Avg | -0.10% | -0.25% | -0.07% | 0.08% | -0.08% | -0.43% |
| Win% | 57% | 30% | 45% | 60% | 51% | 44% |
| SPX Presidential Year 2 | ||||||
| Year | Mon | Tue | Wed | Thur | Fri | Totals |
| 1930-2 | -2.92% | 1.81% | 1.59% | -1.29% | 0.56% | -0.24% |
| 1934-2 | -2.21% | -0.41% | 1.65% | -1.02% | -2.77% | -4.76% |
| 1938-2 | -1.92% | 2.64% | -0.75% | -0.92% | 1.35% | 0.40% |
| 1942-2 | -0.46% | 1.03% | 0.11% | -0.11% | -1.13% | -0.56% |
| 1946-2 | -1.75% | 0.11% | 0.56% | -0.17% | -0.33% | -1.58% |
| Avg | -1.85% | 1.04% | 0.63% | -0.70% | -0.47% | -1.35% |
| 1950-2 | -1.13% | 2.28% | 1.76% | 1.44% | -0.11% | 4.24% |
| 1954-2 | -0.07% | -0.33% | 0.23% | 0.33% | -0.43% | -0.26% |
| 1958-2 | 1.22% | 0.17% | -0.02% | 0.54% | 0.69% | 2.60% |
| 1962-2 | 0.00% | -1.82% | -1.02% | 0.39% | 0.69% | -1.75% |
| 1966-2 | -0.18% | -0.65% | -0.67% | 0.60% | 0.30% | -0.60% |
| Avg | -0.04% | -0.07% | 0.06% | 0.66% | 0.23% | 0.84% |
| 1970-2 | 0.04% | -0.95% | 0.06% | 1.26% | -0.23% | 0.18% |
| 1974-2 | 0.76% | -1.16% | 1.07% | 0.10% | -0.29% | 0.48% |
| 1978-2 | 0.20% | -0.93% | 1.29% | -0.09% | -0.29% | 0.19% |
| 1982-2 | 0.68% | -0.11% | 0.90% | 0.03% | 0.54% | 2.05% |
| 1986-2 | -0.05% | 0.82% | 0.21% | -0.30% | 0.95% | 1.63% |
| Avg | 0.33% | -0.47% | 0.71% | 0.20% | 0.14% | 0.90% |
| 1990-2 | 0.45% | -0.39% | -0.90% | 0.30% | -1.02% | -1.55% |
| 1994-2 | -0.33% | -0.02% | 0.17% | 1.04% | 0.17% | 1.03% |
| 1998-2 | -0.22% | -1.60% | -0.09% | -2.10% | 0.10% | -3.91% |
| 2002-2 | -0.38% | -1.84% | 0.55% | -2.70% | -3.83% | -8.20% |
| Avg | -0.12% | -0.96% | -0.06% | -0.86% | -1.15% | -3.16% |
| SPX summary for Presidential Year 2 1930 - 2002 | ||||||
| Avg | -0.46% | -0.07% | 0.35% | -0.14% | -0.27% | -0.56% |
| Win% | 33% | 37% | 68% | 53% | 47% | 47% |
| SPX summary for all years 1928 - 2005 | ||||||
| Avg | -0.14% | -0.07% | 0.06% | -0.16% | -0.16% | -0.46% |
| Win% | 45% | 41% | 55% | 49% | 47% | 44% |
Conclusion
There is no evidence of a bottom.
I expect the major indices to be lower on Friday July 21 than they were on Friday July 14.
This report is free to anyone who wants it, so please tell your friends. They can sign up at: http://alphaim.net/signup.html. If it is not for you, reply with REMOVE in the subject line.


