


Flames erupting, buildings collapsing and gold rising, but where are the professionals? Lack of volume suggests professionals may be expecting "peace in our time" and lower prices.
GOLD
LONG TERM

While the weekly action tacks on another X or two on the upside on the long term P&F chart it just continues as two flag poles next to each other and giving no clear signal other than the original bear signal a few weeks back. We need some lateral action to provide a better chart picture to get a better feel as to what this chart is telling us.
The above chart is a daily chart but used towards a long term assessment of the gold market. I often mention that I may be looking at a daily action chart when doing the analysis although I usually show a weekly one in the space above. Shown are both the long term RSI (in daily mode) and the volume indicator with its long term moving average line used to assess the long term volume trend. Let's go through the long term assessment using this chart. You might call this a mini-tutorial or something. It should give you some feel for how my mind works (on the rare occasions that it does).
First, let's look at the price and moving average interplay. As long as the price is above the moving average line AND the moving average line is sloping upwards we have a positive situation. That's what we have here. A few weeks back we had the price drop below the line for a possible negative sign but the moving average was still pointing upwards and what we had, at worst, was a cautionary signal, which was resolved to the up side. The real difficulty with this price/moving average concept comes during periods of lateral price action when the price may oscillate above and below the moving average line. This was the situation earlier in 2005. When there is no clear cut appraisal of the price/moving average trend we then rely upon other indicators and charts. The first of these other indicators is the momentum (or strength) indicator.
I like using the Relative Strength Index (RSI) as my primary momentum indicator. In addition I use it in a manner not used by many, or possibly any, other technician. There are literally dozens of different momentum indicators. My advice is to use the one YOU are most comfortable with and provides you with REASONABLE results (remember, there is no such thing as perfection).
When J. Welles Wilder developed this indicator in the late 1970's he recommended the use of a 14 day period for the indicator. Subsequently the 9 day period became very popular. Both are widely used, along with a smattering of other periods. I use a time period that provides me with information about the developing strength of the price action relative to the investment time period being considered. For this reason I use a 30 week or 150 day RSI when assessing the long term trends. So, what do I look for in the RSI?
Essentially there are two things I look for. There are numerous pieces of information that the RSI provides but I will only focus on the primary two. First, is the strength of the price action still positive or is it negative? Second, whatever the strength, is it getting stronger or is it getting weaker?
The 50% line on the RSI is the neutral line. Above the line the long term strength of the recent price action is still positive while below the line the strength is negative. That's the easy part. As the chart shows, the RSI has been in positive territory throughout the chart period. It came close to going below the neutral line a few times but stayed positive. Since the start of the bull market this RSI has crossed into the negative zone only once, for a period of 9 days in mid-May of 2004.
The other piece of information is a little more difficult to assess using the RSI. Is the strength getting stronger or getting weaker? For this I take a short term 9 day weighted moving average of the RSI and use the slope of the moving average line for my "trend". If the slope of the 9 DMAw of the RSI is positive then the RSI is continuing to get stronger, a good thing. If the slope is negative then the RSI is getting weaker, not a good thing. One would hold off any purchase during a period when the slope of the RSI moving average line was negative and wait for it to turn around and show increasing strength. A long term investor would have refrained from purchases starting right at the top on May 15 and would only have considered new purchases on June 23, $100 lower.
The third indicator I look at to assess the long term status of gold is the volume indicator. For this I use the simple On-Balance Volume (OBV) indicator. Volume action is not an important long term indicator. For the long term I mainly use it as a confirmation indicator for the price trend. If the OBV is above its long term moving average line and the price is above its line, we have confirmation of trend. You will note that during the time that the price moved below its moving average line a few weeks ago the OBV stayed above its moving average line suggesting a lack of investor support for the price move. I use a simple 89 DMA for the long term OBV. The long term moving average line is somewhat aggressive for long term information so one would take its non-confirmation of price action with caution.
From this how would you assess the long term position of gold? Correct, it is still BULLISH.
INTERMEDIATE TERM
The process, charts and indicators are the same when assessing the intermediate term as when assessing the long term. Only the parameters differ to account for the more aggressive investment time period. Only the volume indicator gets a little more attention here than in the long term but all else is basically the same.
The chart shows the intermediate term indicators with the daily chart. I wouldn't go into a detail explanation of each indicator as it would be basically a repeat of what was said during the long term mini-tutorial. The main thing you need here is to know the new parameters for this time period.
For the price moving average I use a 65 day weighted moving average. The industry uses primarily a simple 50 day moving average for the intermediate term. If you place the two on the same chart they are almost on top of each other. The 65 DMAw line may turn around at reversal points a day or so earlier than would the 50 DMA.

The momentum is the 50 day version of the RSI. To determine if the RSI is gaining or losing strength I use a 7 day weighted moving average of the RSI and, as with the long term, use the slope of the moving average line.
The volume indicator is the same as for the long term with the moving average line changed. Here I use a simple 34 day moving average line.
So, what would be your assessment of the intermediate term position of gold?
Well, we have a price above a positive moving average line. We have a momentum in the positive zone and although not on the chart we also have a momentum moving average line that is sloping upwards. Lastly, we have the volume indicator above its moving average line albeit only by a little.
So, all in all I guess we would say that the intermediate term can be rated as BULLISH at this time.
SHORT TERM
For short term analysis things are not as clear cut and simple as for the intermediate or long term. Rather than going through a separate mini-tutorial for the short term I'll just say that readers should be able to get the basics of my short term techniques from reading these commentaries. There are a variety of indicators that I look to and not always every week. Some weeks one group if indicators are more applicable while at other weeks it could be different indicators. Let's see what works this week.
The chart shows a short term moving average (15 DMAw) and a short term momentum (13 Day RSI). Also used for short term analysis are the OBV and the daily volume action (the vertical bars at the bottom of the chart). All of these indicators (except the daily volume action) are showing positive trends. In addition, we are inside an up trending channel, a new one this week and more aggressive than the one we had a couple of weeks back. On the cautious side is the daily volume action which does not suggest an enthusiastic speculative backing for this latest move. How long the move can last is unknown but unless the volume perks up I can't see it lasting all that much longer. The RSI is just about ready to enter its overbought zone. How long it stays there before a reversal sets in is also unknown at this time.
For now I must go with the trend in motion and look towards higher levels over the next week or so.

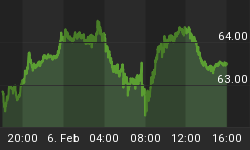
IMMEDIATE TERM
Trying to assess what's going to happen in the next day or two is about as risky as it gets. Another bomb and you see an additional $50 added to gold, peace and it may drop like a rock. Too bad that gold is so volatile based upon war and peace.
The chart shows the price of gold in a nice climb above its very short term moving average line (8 DMAw) and within a defined up trending channel. The Stochastic Oscillator had entered its overbought zone over a week ago and is now tracing a lateral path similar to the one it traced in April and May. Are we to see a similar performance? Well, so far so good. One can only assume that the trend will continue into the early part of the week. Should the price trend accelerate and break through the latest upper channel line THAT might be a signal that the trend is entering a blow-off stage and the slightest reversal and a plunge might ensue. On the other hand, should the trend continue within the new channel, or even slightly below it, it could then continue for some time. I go for the continuation of trend.
NORTH AMERICAN GOLD INDICES
I guess that this week it is the turn of the AMEX Gold BUGS Index to be looked at. Although loosing ground after a drop well below its long term moving average line the moving average remained positive and we now have a rally back above the moving average. Momentum is where we see ground lost. Long term (not shown) momentum continues to weaken although it is still inside its positive zone. We had a well defined negative divergence at the May top (which can also be seen in the intermediate term momentum). The subsequent plunge took momentum right to its neutral line but not below. It is now bouncing off the line with the rally. So from the long term perspective we are still okay.
Looking at the chart and the intermediate tern information, we had been in a bearish situation these past several weeks but it seems that the rally has brought some positive into the picture. The Index is now above its moving average line and although the line has not yet turned fully upwards it is almost there. Momentum has once again moved into the positive zone but is very weak. Momentum seems to be turning back to the down side and even a very short period in the down direction would take it back below the neutral line. Intermediate term can only best be rated as NEUTRAL

MERV'S PRECIOUS METALS INDICES
We are in a strange situation. Gold, and to a lesser extent silver, are having a good run into higher territory but the stocks are doing nothing. The more speculative stocks are still in the doldrums and moving lower. It appears that stock speculators and professionals are not that convinced that the price of gold and silver will stay at these high levels, or go much higher. Or it could be that they are the ones selling stock and buying the bullion to protect their capital from some catastrophe. If that is so the strategy escapes me. I still think that should there be a collapse in the financial markets due to a war or something, then the place to be would be the gold stocks as they will rise far more than enough to compensate for currency shifts and gold rise, actually double or triple the amount needed to compensate. But that is only me.
On the whole the Merv's Indices can best be described as having a neutral week. The three gainers barely gained a fraction of a percentage while the losers varied. Only the bottom of the quality scale had losses into the single digit, the rest were less. This was more like a holding action than a concerted buy or sell action.
MERV'S GOLD & SILVER 160 INDEX
The overall universe, including mostly the aggressive stocks, lost 0.6% on the week. This was primarily due to the more speculative segment of the component list. From the sector Indices we see that the quality stocks closed the week unchanged while the other end of the spectrum, the gambling stocks showed a loss of 1.5%. The specific speculative silver stocks did even worse at a loss of 2.5%. So, the performance went from bad to worse as the quality of the stocks went from best to speculative.
Long term the charts and indicators still show a positive picture but with a caution. Although the Index is above its long term moving average line it is not showing great enthusiasm for more upside action and one must watch for another drop in the Index. It is not a sure thing but one should be prepared. Momentum is still in its positive zone but has dropped a lot from its previous high level and there is no clear cut indication that the drop will not continue. For now the long term is still bullish but needs to be watched.
Intermediate term we almost have the opposite situation. The Index is below its negative moving average line and momentum, although positive, is just barely so and seems to be pointing towards the negative. The intermediate may be rated as minus neutral (just a step from bearish) due to the momentum still in the positive zone.
As for the breadth performance during the week, we had 73 advancing stocks (46%) and 84 declining stocks (53%) for about an even split with a tilt towards the negative. What has that done to our overall stock ratings? Not much. Except for minor % changes the ratings are the same as last week with the short term as BULLISH, the intermediate term as BEARISH and the long term as NEUTRAL. With the long term Index rated as bullish and the overall individual component stocks rated as neutral, one or the other should change very soon.
My preferred investment time period is always the intermediate term. Although there are individual stocks that are bullish and may be moving higher, they are few at this time (this may change on a week's notice). These stocks are for the more gambling spirit and not for the "investing" individual. In general, I would be inclined to wait for the technical picture to brighten up a little more, especially on the intermediate term, before jumping back into the market. Potential profit with peace of mind always beats potential profit with a bottle of Valium.
MERV'S QUAL-GOLD INDEX
MERV'S SPEC-GOLD INDEX
MERV'S GAMB-GOLD INDEX
These are the three precious metal sector Indices that I follow each week to see how different sectors are doing. The overall universe was looked at above.
As you get progressively more speculative the sector provided you with a decreased performance during the week. The Qual closed unchanged, the Spec closed with a loss of 0.4% while the Gamb closed with a loss of 1.5%. As for the charts, on the long term all three Indices are above their long term moving average lines and the lines are all pointing upwards. We have a similar uniform picture looking at the long term momentum. All are in their positive zones. So, for the long term all the Indices can still be classified as bullish.
On the intermediate term we have all Indices agreeing except for the Qual moving average. The Qual is above its moving average but the line is sloping lower. The other two Indices are below their negatively sloping moving average lines. As for momentum, all are in the positive zone but only barely. From this one might rate these Indices as minus neutral (just above bearish) except for the Qual, which might be rated as plus neutral, just below bullish.
As for the breadth indicators, The Qual Index had a 50/50 split in advancing issues versus declining issues. It then got progressively worse as we moved to the more speculative Indices. As for the overall individual stock ratings, that has not changed materially since the previous week. A few minor % shifts but overall ratings basically remained the same.
SILVER
These commentaries are originally posted in the Merv's Precious Metals Central subscriber's section and then reviewed for its applicability to the general audience. It was then noticed that the silver section had inadvertently been omitted this week. It will return next week.
MERV'S PRECIOUS METALS INDICES TABLE

Click to open larger image in new window
Well, that's it for this week.


