


Is this what they call slow torture? A slow climb but still far from the July high. Merv's Gold Indices, however, show that the stocks HAVE breached July and heading towards all time highs. GO GOLD GO!
GOLD
LONG TERM
We still have that anomaly where the long term P&F chart is still under the spell of a long term bear but all the other indicators are bullish. Nothing much has happened in the P&F chart so we'll leave it for another week.
The usual suspects are all in sync, on the up side. We have gold above its long term moving average line and the line continues to turn upward. Momentum continues in its positive zone although still with underwhelming strength. The volume indicator has just climbed above its long term trigger line (it seems to be oscillating above and below on almost a weekly basis) but is showing weakness versus the price. Although the price of gold has made a new rally high the volume indicator is still far below its level from the early Nov high.
Despite the still bearish P&F chart and some weaknesses shown in the momentum and volume action I will continue with a BULLISH long term prognosis. One should stay with a trend until it confirms a change.
INTERMEDIATE TERM

First looking at the intermediate term P&F chart I see some difference between my computer software chart and my own hand technique chart with my chart showing an additional up and down move versus the software. However, this has not made much of a difference in the final analysis except that my hand drawn chart gives me another intermediate term projection, to $690, that the software does not. Other than that the P&F continues to move higher in a new bull move, headed towards the $700 environment but exactly where is a good guess since I have now two projections, one at $690 and a previous one to $715. The important thing is that neither projection takes us into new highs.
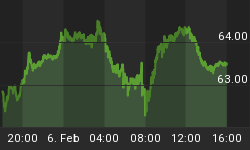
From the chart above we can see the action taking place well above the intermediate term moving average line (65 DMAw) and the line continues to slope further upward (is that grammatically right?). Momentum continues to move slightly higher in the positive zone but not with any real vigor. The momentum indicator suggests a sluggish price action versus recent action. As for volume (not shown) the indicator is sitting just under the intermediate term trigger line for a neutral reading.
All in all, the intermediate term indicators are positive but could be a lot better. For now I will remain BULLISH, intermediate term wise.
SHORT TERM

It was looking pretty bad there for a while but sticking with the confirmed trend was the right thing to do last week. Despite a minor lower close on Monday, the rest of the week was all up hill with one day off for the American turkey. Here in Canada we have our turkey a month earlier because we can expect snow storms this time of year and who is thankful shoveling snow?
Looking at the action, we are still in a short term bull with all indicators on the plus side. Price above the short term moving average line (15 DMAw) and momentum (13 Day RSI) inside its positive zone. Momentum is still slightly lagging the price action with the Friday value not quite above its value of a few weeks ago while the price made a new rally high. One would like to see momentum leading the price and show greater strength. What we have at present gives one caution about the longevity of the rally. However, it is rallying so we shall continue with the short term BULLISH position.
IMMEDIATE TERM
What to expect on Monday and possibly Tuesday? Well, one is more often right than wrong by continuing with an established trend, unless the indicators are giving you a clear warning otherwise. Right now the established trend is bullish and there is no clear warning from the Friday indicators of an imminent reversal (it could always happen, strange things occur during the week-end affecting Monday's action that were not known on Friday). So, I would expect gold to continue higher on Monday.
The $615 to $660 area is one of some clear resistance from the earlier action. One might expect that the rally might come to a halt temporarily in this area, or maybe even reverse. The next major point to look forward to would be first a break into new rally highs above the July high and then new bull market highs above the previous May high.
NORTH AMERICAN GOLD INDICES
Well, it's been four weeks so it is the turn of the S&P/TSX Capped Gold Index to be looked at. The "Capped" in the title indicates that the weight of an individual gold stock, towards the calculation of the Index value, is capped at a maximum of, I think, 25%. With 18 stocks in the Index the value of the Index is heavily controlled by a few heavily weighted stocks. However, on with the review.

All four of the major North American Indices that I look at in rotation here have the same problem. Although they are all in rally mode they have not yet breached their earlier highs from a few months back, least of all the May high. Up until now the rally did not have any great strength behind it as evidenced by the trend of the momentum indicator. The rather shallow up trend in the momentum indicator suggests a labored advance in the price. In addition, the volume indicator is another indicator that has not been giving us a glowing report. Although it held up pretty well during the Sept decline it has not zoomed ahead during the rally as one would want to see it do if the trend was strongly positive. So, although all the indicators are in positive territory none of them are very encouraging, at least not up to this point.
Not highlighted but we still have the head and shoulder pattern in place although much more lateral price trend and I will give up on it.
S&P/TSX Global Gold Index
The Toronto Stock Exchange and Standard and Poor's are about to introduce a new gold Index, the S&P/TSX Global Gold Index. It will include stocks of companies listed on the Toronto, New York and NASDAQ. It seems to be intended to represent not only gold mines but also gold investment companies such as those from South Africa with ADR trading in the US. It will be interesting to see what this Index really is and what the component stocks will end up to be. Once more, as is the common policy, the stocks will have a weighting towards the Index value calculation but as with the S&P/TSX Gold Index, it will be a capped valuation criteria with a cap at 25% for any individual stock. When introduced and when I can obtain enough historical data, this Index will be included in the Merv's Precious Metals Gold Indices table and become part of this weekly review.
MERV'S PRECIOUS METALS INDICES
Another good week for the precious metal stocks. That's six out of the past seven weeks on the up side. Unlike the major North American Indices ALL of the Merv's Indices have now moved above their previous July/Sept highs and have very little left in their way towards new all time highs.
As with the various Merv's Indices, Merv's Composite Index of Precious Metal Indices, which is based upon the performance of all 23 Index components, has also moved into new rally highs above its July/Sept highs. All of its indicators are positive for both the intermediate and long term periods. I am therefore BULLISH on this Index for both periods.
MERV'S GOLD & SILVER 160 INDEX
The average gain of the universe of 160 stocks was 5.9% on the week. An okay performance for one week. The universe of 160 stocks breached its previous July/Sept highs two weeks ago and is making new highs this week. All indicators are GO so no need to expand. BULLISH on both the intermediate and long term.
The great weekly performance is noted by the fact that 82% of the 160 stocks closed up on the week and only 13% closed down. The overall component ratings are also all in the BULL side with a BULL 71% short term, BULL 77% on the intermediate term and BULL 62% on the long term.
MERV'S QUAL-GOLD INDEX
MERV'S SPEC-GOLD INDEX
MERV'S GAMB-GOLD INDEX
The three sector Indices had a good week with all three having almost identical gains at 5.75% plus or minus 0.05%. It's interesting to see such close gains while the actual percentage of advances to declines vary. For the Qual-Gold Index we had 97% advancers, for the Spec-Gold Index we had 90% advancers and for the Gamb-Gold Index, only 73% advancers. This is good as it shows that outright speculation has not yet entered the market.
As mentioned earlier, all three sectors are now into new rally highs with only the previous May high holding them back from all time highs. All the indicators for all sectors are positive so I'm BULLISH on the intermediate and long term for all three sectors. The average ratings of the sectors is also interesting. The three ratings for the Qual sector average in the 86% level, for the Spec sector the average is 74% and for the Gamb sector it averages at 61%. So, the higher the quality the higher the % of stocks that are bullish. One good indicator that the rally may still have some more upside to go.
SILVER

Well, silver seems to be right up against the ceiling. A strong resistance level that must be penetrated with vigor or else it could mean lower levels ahead. A move to $13.50 would do it but $13.75 would be better. Then on to $15 an above. Scenario seems wonderful, let's hope it plays out as written. One caution, the contract month being used for the daily data is about to expire. The next contract month to be used will suddenly show an increase in price, which is really somewhat erroneous from the continuing data standpoint. So, as we go through the transition we may have to be a little careful if the price suddenly breaks through the ceiling and understand the transition. Just one of those little quirks that cause annoyances in the market. As I so often mention, nothing is perfect.
MERV'S QUAL-SILVER INDEX
MERV'S SPEC-SILVER INDEX
The best and worst performances of the week were shown by these two Indices. The Spec Index had the best with a gain of 7.5% while the Qual had the worst at 5.1%. With 9 stocks in double digit gains it's surprising that the Spec Index only gained 7.5%. This is still where the action in the precious metals is the best. Bullish trends all around. Stick with these stocks but realize that the early big movers can also turn out to be real bummers should the environment suddenly change. Always have your exit strategy handy.
RECOMMENDATION
The precious metals appear to be on the move once more but that move is yet very muted. The strength behind the move so far leaves a lot to be desired. However, if the move continues this is the time to be thinking of getting back in for maximum gains. It is also the most risky time as reversals happen and they do so when it looks like everything is on track. I would say to go for it BUT always keep your investments or speculations protected against unexpected reversals. Another Bre-X could be just around the corner.
Sur American Gold Corp. (V/SUR)
One of the features of my weekly subscription service (Merv's Precious Metals Central) is to highlight those stocks from my universe of 160 which were previously rated as NEG (Bearish) and had just turned POS (Bullish) during the week, on the intermediate term ratings. I have shown several such stocks in these commentaries that had done so and were great movers. One such stock this week is Sur American Gold Corp. I show it here for your information. I have no fundamental information on the company as I am a pure market technician. A detailed technical analysis of SUR may be found in the Stock Review section of my service.

MERV'S PRECIOUS METALS INDICES TABLE

Click to open larger image in new window.
Let's call it another week.


