


Honest Money
Gold & Silver Report
Gold & Silver
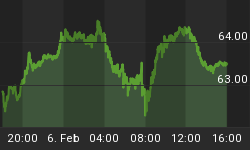
Gold closed the week out at $650.60 up $15.20 for a gain of +2.39%. It is sitting right below its 61.8% fib retracement level. A break above this level would be very positive. The first chart below shows the various fib levels for gold.
Silver closed the week at $14.19 up 0.96 cents for a +7.27% gain. The second chart below shows silver's strong rally that has retraced 83% of its loss since mid-May. Silver has been stronger than gold so far during the recent rise. The second chart below shows the fib retracement levels for silver.
Gold
Silver
HUI Index
The next chart shows the HUI/Gold ratio since the beginning of the gold bull market back in 2000 - 2001. During the long term rising trend the ratio had four (4) intermediate term rises.
The third move up made a lower high than the second move. Presently the ratio is starting its fourth move up. A higher high needs to be put in place to confirm the recent rally in the gold sector.
As we have said in the past, we would not at all be surprised to see physical gold lead the rally in the pm sector, at least initially, with the HUI kicking in high gear soon after.
HUI/GOLD RATIO
Next up is another long term chart of the HUI Index. It shows four (4) falling trend line break outs. Once these break outs occurred powerful rallies then ensued. Just this past week another break above a falling trend line occurred.
RSI has confirmed the break out, and a bullish MACD cross over has occurred as well. All the pieces of the puzzle are falling into place. The second chart shows the most recent break above the falling trend line.
Here too, the pieces are falling into place. We would like to see the HUI/Gold ratio confirm as well. This would be the last piece of the puzzle.
HUI INDEX
Next is the weekly chart of the HUI which shows the recent break above its falling trend line. RSI has confirmed, and so has a bullish cross over of MACD.
HUI Index Weekly
Often times after a break out as has occurred, the market will correct and test the break. This is not a given, but it does happen quite regularly.
The market may also continue up for a while, and then move sideways, consolidating its gains. Or the market can just power ahead or even fall back below the break, signaling a false break out as occurred in several weeks ago.
Up next is a chart from KJ who has graciously offered to share his work with us. The chart shows the long term breaks above the XAU's falling trend lines. The chart speaks for itself so we will add nothing further. Our thanks go out to KJ.

Click to open larger image in new window.
Finally we have a chart by Alexandra. It is a chart of the gld/hui ratio which has been on a buy for several weeks, and has been correct. Once again, the chart speaks for itself. Thanks to both KJ & Alex.

Summary
Interest rates remain key, as they affect all other markets. If rates fall then bonds do well. If long term bonds do well, the mortgage and real estate markets hold together. Rising interest rates would do serious damage to the bond and real estate market.
Already a slowdown in the housing market has been occurring. Rising rates would greatly exacerbate the situation. The dollar may like rising rates initially, but we are of the opinion that a time is fast approaching when even rising interest rates will not help the dollar. What concerns us the most if the event is to be accompanied by orchestration - or not.
Interest rates also affect liquidity, which is the name of the game in paper fiat land. There is an ocean of liquidity that has produced asset price inflation in most of the markets, not only in the US but abroad as well. Only the middle-east stock markets have not been saved by the massive amounts of liquidity pumped out of every available means.
Recently both oil and the commodity markets, including the precious metals, have undergone sizable corrections. Presently the pm sector is performing the best with its recent break out. Oil and the CRB are doing better as well, and appear to be in the process of forming a bottom.
We are considering positions in both oil and natural gas - we favor natural gas and are looking to buy weakness.
The US Dollar is fast approaching its long term lows, which has not gone unnoticed by the pm sector. We are not, however, convinced that an immanent break of the lows will happen during this move - it may, but we will be from Missouri and say: show me.
Gold, silver, and the pm stocks have been performing quite well. As the charts show - the gold stocks have just broken out above their upper falling trend line. RSI and MACD have confirmed the move.
The only caveat is that we would like to see the HUI/Gold ratio put in a higher high, as the third long term move up put in a lower high. A higher low is in place and it looks like a higher high will be in shortly as well. Caveat Emptor.
We plan to start accumulating further gold and silver stock positions, especially on any weakness, be it in certain individual stocks that we like, or even intra-day lows in the same individual stocks. We are prepared and willing to buy strength if need be.
Often times after an initial break out, a test of the break will occur, sometimes by downward corrective action, and sometimes by sideways consolidation. We would not be surprised if this were to occur, and would readily use it to accumulate new positions.
The above is just the precious metal's section of our full 22 page market wrap, which includes most major markets. Drop by our website to check it out. There are also numerous articles on gold and silver, not only from an investment perspective, but as the honest monetary system of gold and silver coin mandated by our Constitution - a system of Honest Money - of Honest Weights and Measures.
There are many other resources available too numerous to list. A live bulletin board is run 24/7 where you can discuss and ask questions and interact with many knowledgeable people from around the world. So drop in and check out what condition your condition is in.

Come visit our new website: Honest Money Gold & Silver Report
And read the Open Letter to Congress

COMING SOON: A REQUEST FOR AN AUDIT OF US GOLD RESERVES


