


Dear Subscribers,
As we approach Christmas and the New Year's holidays, I hope that many of you will have time to reflect on what you have done or achieved over the past year - whether those achievements are in your personal life, your career, or your realm of investment knowledge. As I have mentioned or implied over the last couple of weeks, I am doing exactly that, as I am currently in Houston for some rest, relaxation, and reflections. Since next Sunday will be Christmas Eve, I am planning to only write an "ad hoc" commentary once again for our subscribers. While there may not be any charts in that "ad hoc" commentary, I promise that there will not be a lack of substance. Mr. Rick Konrad from the excellent investment blog Value Discipline will be again writing for us this Thursday morning. I will then come back with my very own preview of the major important themes for 2007 next Thursday morning (December 28th).
Before we continue with your commentary, let us do an update on the two most recent signals in our DJIA Timing System:
1st signal entered: 50% long position on September 7th at 11,385, giving us a gain of 1,060.52 points
2nd signal entered: Additional 50% long position on September 25th at 11,505 giving us a gain of 940.52 points
Our first signal has given us a gain of over 1,000 points - and while many newsletter writers will relish in such a "feat" (especially in light of this difficult year), we are definitely not being complacent at this point. The current rally that effectively began in mid-August is now "long in the tooth" - at least relative to the magnitude, length, and breadth of the many rallies we have had since January 2004. However, subscribers should continue to keep in mind that the four months ending August 2006 represented a period of capitulation at least among retail investors - as exemplified by the highest mutual fund outflows for that period since the four months ending October 2002. Make no mistake: A rally off such a significant bottom will usually not end until exhaustion - and we are still not close to such a point yet.
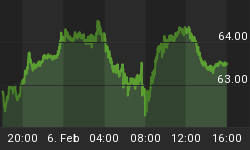
As of Sunday afternoon on December 17th, we are still fully (100%) long in our DJIA Timing System and is still long-term bullish on the U.S. domestic, "brand name" large caps - names such as Wal-Mart (which is now making a serious effort in the Chinese market by acquiring Taiwanese-owned Trust-Mart and naming a more aggressive new head of operations in China), Home Depot (which is now also expanding in China), Microsoft, eBay, Intel, GE, and American Express. We are also bullish on both Yahoo, Amazon, and most other retailers as this author believes that "the death of the U.S. consumer" has been way overblown. We are also very bullish on good-quality, growth stocks. In the very short-run, the market still has enough strength to rally until the end of this year, and possibly into early to mid January if we do not have a significant correction in the meantime. Based on current sentiment and breadth, there is a good chance we will not see a significant correction (meaning 5% or more) in the major stock market indices until the DJIA approaches the 13,000 level or the S&P the 1,500 level.
In last weekend's commentary, I gave a quick update of U.S. household finances as of the end of the third quarter 2006. In that commentary, I discussed the relatively low holdings of equities (especially domestic equities although we do not have reliable statistics of how much international equities U.S. households are holding) of U.S. households as a percentage of both total and financial assets. While the bears will "relish" in the fact that the Asset-to-Liability ratio of U.S. households has continued to decline over the last 54 years, it is imperative to keep in mind that an asset-to-liability ratio of 5.2 is still very manageable - especially in today's low interest ratio environment and the easy availability of consumer credit. In light of the Bank of England's study that we discussed last Thursday, however, the $64 trillion question to ask is this: How are assets of households' private businesses taken into account in the Federal Reserve's Flow of Funds data? This has special importance - especially over the last two decades as U.S. households have continued to be more entrepreneurial in nature. While holdings of publicly-traded equities, bonds, and cash are very easily valued, it is very difficult to value private businesses even if the Federal Reserve has in its possession all the income tax returns of private businesses in the U.S. Assuming that it does (and assuming that the IRS has perfect records), however, it is highly doubtful to this author that the Fed is valuing U.S. private businesses at anything other than book value - a measure which is too conservative by any stretch of the imagination. Assuming that this is true, and assuming a price-to-book ratio of 2 is appropriate (which is slightly over 10% less than the P/B ratio of the S&P 600) - then there is a good chance that the Federal Reserve is valuing U.S. private businesses at half of their true worth (or even less for businesses that are not capital or real estate intensive, such as MarketThoughts.com!). If that is the case, then according to the latest Flow of Funds data, U.S. household assets may be undervalued by more than $7 trillion - or just slightly over half of all U.S. household liabilities.
Okay, so much for another "rosy analysis" on U.S. household finances. Subscribers are probably getting tired of this already. Let us now get to the gist of our commentary and discuss a commodity that was the first to top out in the latest cyclical bull market for commodities - that being, natural gas.
We first discussed natural gas in detail in our July 31, 2005 commentary ("Natural Gas - the Other Bull?"). In that commentary, we discussed the fact that natural gas production has been steadily declining in the lower 48 states of the US, despite the fact that rig count had increased 80% since 1997. More ominously, this situation could also be directly applied to Canadian production (which supplies nearly 20% of all US consumption). Quoting a National Energy Board December 2004 report: "[the] effective decline rate for production from existing wells is expected to remain at around 21% per year. This means that new connections would need to replace over a fifth of the previous year's output to keep overall production constant." Moreover, the "trend of lower initial productivity in new WCSB gas wells [the Western Canada Sedimentary Basin - which currently accounts for 98% of total Canadian production] is continuing. Consequently, to offset production declines from producing wells, the number of new gas connections must rise each year to maintain production levels. The Board expects that the number of gas wells drilled would need to increase from 15,100 in 2003 to about 15,600 in 2004, and 17,900 by 2006 in order to maintain current production." In other words - according to the Canadian government's National Energy Board at the time, Canadian production most probably was near a peak as well.
In that commentary, we also discussed the relatively high correlation of natural gas prices vs. crude oil prices (the historical "6-to-1 ratio" on an MMBtu/barrel basis). I concluded that given this declining supply, this high correlation, and the high tendency for natural gas price spikes (natural gas has historically been three times more volatile than oil prices), then there was also a good chance natural gas prices would spike higher sooner than later. Quoting from our July 31, 2005 commentary: "In a high demand (unusually cold weather) environment and assuming that oil prices stay at $60 a barrel during the winter, I would not be surprised to see a "sustainable" natural gas price of $15 to $17/MMBtu somewhere during that timeframe (assuming this historical relationship holds)." By a sheer stroke of fortune, natural gas prices did indeed touch these levels very soon after the publication of our commentary - with the one-two punch of Hurricanes Katrina and Rita, and with the subsequent colder-than-expected winter in early to mid December 2005.
Most recently, however, natural gas prices have steadily increased and then plunged during the August to September 2006 period. The following chart showing the prices of the January 2007 natural gas futures contract illustrates this bear market in natural gas perfectly:

Moreover, the historical "6-to-1" relationship" with crude oil prices has broken down recently, as illustrated by the following chart showing month-end crude oil spot prices vs. month-end natural gas spot prices at the Henry Hub from November 1993 to December 2006 (with the December 2006 month-end prices estimated using the December 15, 2006 closing prices):

So what is up with natural gas? Hasn't North American supply peaked? Isn't LNG supply from countries such as Albania and Russia still at a trickle? Aren't we consuming natural gas at an ever-increasing rate? All these are worthwhile questions. This author believes that the weakness in natural gas prices is due to the following three main factors:
1. Good old demand destruction as a response to a surge in natural gas prices from Fall 2005 to December 2005. Not only did many industrial users resort to "fuel-switching" (switching from consuming natural gas to oil) during this surge in natural gas prices in late 2005, many industrial users actually closed down or relocated their businesses overseas in response to this higher cost. Unlike demand destruction at the residential or commercial level, this demand destruction on the part of industrial users means that demand from this segment will never come back. Moreover, the ability of many industrial users to shift between consuming oil to natural gas (and vice-versa) has historically played a significant role in determining the correlation between oil and natural gas. Now that many industrial users have been removed from the equation, there is a good possibility that this historical "6-to-1" relationship has now effectively broken down.
2. Much of the spike in natural gas prices during late November to early December 2005 was due to a speculative shift into the commodity by hedge funds (the natural gas market is significantly less liquid than the crude oil market and is thus more easily subjected to "manipulation"). At the time - despite the fact that the early winter was colder than usual - supply was still ample. However, everyone and his neighbor were merely extrapolating the temperatures in early December 2005 into January and February 2006. In retrospect, both the months of January and February 2006 were warmer-than-usual. As the hedge funds exited the commodity, natural gas prices subsequently plunged over the next couple of months. After this price spike, natural gas no longer attracted any new money from hedge funds. The liquidation of the hedge fund Amaranth was the final straw - as its collapse resulted in a crash in natural gas prices as the fund exited from its long positions in natural gas.
3. Storage levels remain ample - as current natural gas storage levels is 8% higher than its five-year average and 7.5% higher than storage levels at this time last year. Not only does this signal that overall demand has actually decreased (mostly because of the decline in industrial demand), but that the market is well supplied as well. In that light, we turn to the EIA's U.S. Crude Oil, Natural Gas, and Natural Gas Liquids Reserves 2005 annual report, which was just released last month. According to the EIA, natural gas reserves at the end of 2005 increased 6.2% from the end of 2004. Quoting the EIA's report: "Reserves additions replaced 164 percent of 2005 dry gas production as U.S. gas reserves increased for the seventh year in a row. Proved reserves of natural gas increased by 6 percent in 2005, the largest annual increase in natural gas proved reserves since 1970." More importantly, total discoveries of natural gas reserves were 23.2 Tcf in 2005 - which was 45% more than the prior ten-year average and 15% more than in 2004. In other words, all those new drilling actually was quite effective (higher prices didn't hurt either) - contrary to our views in our July 31, 2005 commentary. Following is a chart showing U.S. natural gas reserves as documented by the EIA from 1995 to 2005:

Please note that natural gas reserves have increased every year with the exception of 1998. More interestingly, note that onshore reserves have actually steadily increased while offshore reserves have steadily decreased during the last ten years! In other words, while there has been ample drilling in the Gulf of Mexico, this is not necessarily the case in deeper offshore waters or in other parts of offshore United States. If push comes to shove, this suggests that domestic natural gas reserves can continue to steadily climb for the rest of this decade should the U.S. choose to drill for natural gas in deeper waters or in other parts of offshore United States.
Conclusion on natural gas: While it is tempting to place a bullish bet on natural gas prices based on the historical correlation between oil and natural gas prices, this author believes there is now a good chance that this historical relationship has now broken down - suggesting that natural gas prices do not have to increase from current levels. More importantly - given the fact that natural gas reserves have continued to steadily increase and the fact that natural gas storage levels remain at the high end of its five-year average - there is a good chance that natural gas prices (especially in the summer contract months) are still very vulnerable to further price declines going forward. Until there is another boom in the construction of natural-gas fired electricity generators (which probably will not happen again until natural gas plunges to the $5.00/MMBtu level and stay there for a whole year) this author will not suggest buying either natural gas futures or natural gas producers and holding them for the long-run.
More follows for subscribers...


