


The precious metals seem to be having a rough time trying to get anywhere. Maybe it's just the season with major speculators taking a holiday?
(Almost) END OF YEAR
An investment radio show in my nation's capital (Ottawa) asked me (along with many others) to provide a few minutes of my views as to where I think the markets are heading in the new year. I did so primarily relative to the general markets and not specifically the precious metals. I just though I'd simplify today's commentary by providing my brief views of the general markets and next week concentrate on the precious metals with a yearly summary of what happened and what I think might happen.
GOLD

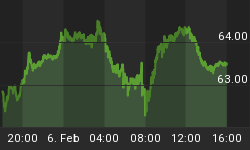
Just a few quick words on gold before I get to the general markets. As one can see from the chart gold has not been going anywhere fast lately. This might be due to traders being on vacation. However, the very interesting features of this week's chart are the volume indicator and the potential short term head and shoulder pattern.
The volume indicator DID NOT confirm the latest new rally high in gold. Worse yet, it is showing greater weakness in the past few weeks by already moving below its support from the Nov action. This is not good.
We have what might end up to be a short term head and shoulder top. The left and right shoulders can be seen as those touching the blue support line at about the $614.50 level. Should the gold price close below that level it could project a short term move back to the $575 level, or there about. Not much to get too worried about.
I'm not as concerned about the short term as I am about the intermediate and long term. Both are still rated as BULLISH but there are warnings that this may not last. I'll have a more detailed look and analysis next week.
AMERICAN MARKETS
In the U.S. we can say there are two different markets. These are represented by the DOW and S&P 500 in one case and by the NASDAQ Composite in the other case. One can go deeper into the classification by including more refined Indices such as the S&P 100, NASDAQ 100 and the NYSE US 100 Indices but the DOW, S&P 500 and NASDAQ Composite cover the major overall American market environment. When I talk about "markets" here I am referring to an Index with a general variety of securities not of any specific industry group (such as, say, the NYSE Energy Index).

Both the Dow and the S&P 500 are very similar in their chart activity so I will only talk about the Dow chart BUT the comments apply equally to the S&P 500. Where there may be a difference I will highlight it.
In a nutshell, my radio view was that the American market was in a roaring bull market from both the intermediate and long term point of view. However, in both cases I can see warnings developing that might be cause for concern over the next while. My final comment about this market was that despite the bullishness this was not the time to be investing new capital but a time for holding and even watching out for an exit. Only further activity would determine which way the market will go from here.
From the chart above you can see why I say we are in a bull market. The Index is above both moving averages, momentum is well in its positive zone and volume continuing to move ever higher. However, the momentum is showing signs of exhaustion. Over the past two months as the Index was making new highs the momentum has been basically tracking a lateral trend. Now this in itself is not a reversal signal but is a warning that things may change in the coming weeks. It's something to be worried about but in the mean time the trend continues higher.
On the long term charts the momentum is again not as strong as the recent price action. Although the Dow has made it into new all time highs (only slightly so from a % basis) the S&P is still below its all time high and needs more work. We'll just have to wait and see if the 30 stocks of the Dow are better predictors of the future than the 500 stocks of the S&P.

My comments against the NASDAQ Composite were the same as for the DOW and S&P so I wouldn't repeat them. What the chart above shows is a more noticeable Index topping than is seen in the Dow chart. Here, the Index has crossed below the intermediate term moving average line but the line is still in a positive direction. More importantly, the momentum is showing even greater weakness here than in the Dow chart. Although the Index is still above its recent support level the momentum indicator has already dropped below its level. We can also see the volume indicator getting weaker. For the first time since mid Aug it has dropped below its trigger line for a negative warning. All in all, the NASADAQ Composite looks weaker than the Dow or S&P. As we all realize, the NASDAQ is still far below its previous all time high.
ADDITIONAL INDICES
I had also taken a look at a few additional industry group Indices and they all were giving me a similar story to that of the market Indices. I was curious about the technology group but the various technology Indices were not all that great, even after some good moves over the past year.
One thing I did notice was the actions in two technology stocks. One has been a run-away favorite for some time now and has more than doubled in the past several months and is well above its 2000 high. The news here has been terrific lately. The other technology stock has been making new lows recently, about 98% below its 2000 high. You would be surprised at what the charts are telling me about these two stocks, both very large "high quality" technology stocks, trading in both the American and Canadian markets. I have included a detailed analysis of both stocks in the subscribers Stock Review section.
CANADIAN MARKETS
As with the American market there are two different markets in Canada. There are the more mature companies traded on the Toronto Stock Exchange (the TSX) and the more aggressive, smaller companies traded on the TSX Venture Exchange, the old Vancouver Stock Exchange. On the Venture is where you will find many of the up and comers in the resource industry. Aurelian Res. Ltd., as an example, was a $0.50 stock in the beginning of Jan and is now trading above the $30.00 level. I only touched on the Toronto market and will do so here.

My view of the Toronto market was the same as for the American market. Bullish on the intermediate term and long term. But also here I can see some warnings that the bull may either be coming to an end or at the least, a rest period of some length. The momentum has dropped below its trigger line as has the volume indicator. Volume had not confirmed the short new high made by the Index a week or so ago. Looking at a long term chart of this Index one can see more vividly that momentum has been seriously lagging the Index action for some time now. All in all, bullish but with warnings of a top ahead.
Again I must remind readers that warnings are only that, a warning of potential ahead. It does not yet proclaim that any turn around has occurred. That requires additional indicators to turn negative.
STOCK REVIEW
Something different this week. The 6 stocks reviewed this week will not be precious metal stocks but stocks taken from the major market Indices. We'll get back to the precious metals next week.
MERV'S PRECIOUS METALS INDICES

Click to open larger image in new window.
That's it for this week.


