


What's happening to the Top Institutional "core holdings"?
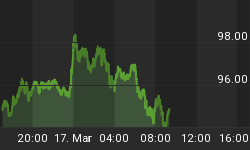
Below is a chart showing the action of the "core holdings" that Institutions own. Collectively, Institutions have trillions of dollars invested in the market, and they are responsible for over 50% of the buying and selling volume.
What institutions do is important. So, what are they doing?
In July of last year, they started the buying that led the market up in its rally. In September and October, they started an aggressive campaign to accumulate stocks as they went on a buying spree. Note the long, thin up channel during that time in the chart below.
Then their buying lost steam and they went into a weaker up channel for a short duration, which evolved to another weaker channel of a short duration. And then, Institutional buying stalled out and their core holdings went into a trading range that has now lasted a total of 24 trading days.
The negative for the Index is that the deterioration of each Institutional channel has been breaking down into less powerful channels.
The last 24 days can best be described as an Institutional "consolidation". Part of the consolidation is occurring because Institutions have been busy rebalancing their portfolios and engaging in sector rotation. Soon, they will be done with that process and a trading range breakout will occur.
If you analyzed each of their core holding stocks, you would find that there is a downward bias because a greater number of these stocks are showing weakness rather than strength. This creates a bias towards the possibility that the index is in a topping process.
If this continues, the breakout will be to the downside and the markets will lose the cooperation from the Institutions to keep the July to January rally in place.

Please Note: We do not issue Buy or Sell timing recommendations on these Free daily update pages. I hope you understand, that in fairness, our Buy/Sell recommendations and advanced market Models are only available to our paid subscribers on a password required basis. Membership information


