


The good news is:
• Since 1887 (120 years) the Dow Jones Industrial Average (DJIA) has been up 70% of the time in the coming week (the last 3 trading days of January and the first 2 days of February) during the 3rd year of the Presidential Cycle (next week).
Short Term
Most of the short term indicators are at or near neutral and showing a very modest positive bias. I cannot draw conclusions from them.
Intermediate term
The intermediate term indicators are not much better.
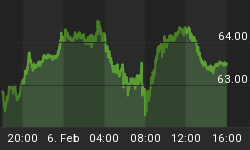
The chart below covers the past 6 months showing the NASDAQ composite (OTC) in red Summation Indices (SI) for advances - declines (AD) in blue, new highs - new lows (HL) in blue and upside - downside volume (UD) in grey.
SI's are running total of oscillators so when the oscillator is above 0 the SI moves upward and when it is below 0 the SI moves downward.
The HL SI had a lower low earlier in the month so you could call its bias modestly positive, the UD SI has been decidedly negative and the AD SI has been slightly negative. There is nothing decisive here.

Seasonality
Next week includes the last 3 trading days of January and the first 2 days of February during the 3rd year of the Presidential Cycle.
In the tables below, OTC data covers the period from 1963 - 2003 and S&P 500 (SPX) data from 1931 - 2003 during the 3rd year of the Presidential Cycle. There are summaries for both the 3rd year of the Presidential Cycle and all years combined beginning with 1963 for the OTC and 1928 for the SPX.
Next week has been a strong week. The OTC has been up 73% of the time since 1963 and the SPX up 79% of the time. The 3rd year is stronger than the averages for all years which are also very positive. Over all years the OTC has been up 64% of the time and the SPX 75% of the time.
Last 3 days of January and first 2 days of February.
The number following the year represents its position in the presidential cycle.
The number following the daily return represents the day of the week;
1 = Monday, 2 = Tuesday etc.
| OTC Presidential Year 3 | ||||||
| Day3 | Day2 | Day1 | Day1 | Day2 | Totals | |
| 1963-3 | -0.03% 3 | -0.48% 4 | 0.45% 5 | -0.42% 1 | 0.00% 0 | -0.48% |
| 1967-3 | 0.02% 5 | 0.49% 1 | 0.37% 2 | 0.26% 3 | 0.19% 4 | 1.34% |
| 1971-3 | -0.29% 3 | -0.47% 4 | 0.91% 5 | -0.06% 1 | 0.93% 2 | 1.02% |
| 1975-3 | 1.71% 3 | -0.13% 4 | 1.15% 5 | 1.36% 1 | -0.85% 2 | 3.24% |
| 1979-3 | -0.21% 1 | -0.21% 2 | -0.55% 3 | -0.05% 4 | 0.05% 5 | -0.96% |
| 1983-3 | 1.66% 4 | 0.61% 5 | 0.58% 1 | -0.08% 2 | 0.05% 3 | 2.81% |
| Avg | 0.58% | 0.06% | 0.49% | 0.29% | 0.07% | 1.49% |
| 1987-3 | 0.33% 3 | -0.27% 4 | 1.04% 5 | 0.54% 1 | 0.55% 2 | 2.19% |
| 1991-3 | 0.96% 2 | 1.98% 3 | 1.39% 4 | 0.84% 5 | 1.70% 1 | 6.87% |
| 1995-3 | 0.18% 5 | -0.93% 1 | 0.45% 2 | 0.41% 3 | 0.70% 4 | 0.81% |
| 1999-3 | -1.10% 3 | 2.93% 4 | 1.15% 5 | 0.17% 1 | -1.86% 2 | 1.30% |
| 2003-3 | 1.18% 3 | -2.63% 4 | -0.11% 5 | 0.22% 1 | -1.33% 2 | -2.67% |
| Avg | 0.31% | 0.21% | 0.79% | 0.44% | -0.05% | 1.70% |
| OTC summary for Presidential Year 3 1963 - 2003 | ||||||
| Averages | 0.40% | 0.08% | 0.62% | 0.29% | 0.01% | 1.41% |
| % Winners | 64% | 36% | 82% | 64% | 64% | 73% |
| MDD 2/4/2003 3.82% -- 2/2/1999 1.86% -- 2/1/1979 1.01% | ||||||
| OTC summary for all years 1963 - 2006 | ||||||
| Averages | 0.06% | 0.09% | 0.31% | 0.16% | -0.07% | 0.53% |
| % Winners | 58% | 59% | 67% | 64% | 70% | 64% |
| MDD 2/2/2001 6.27% -- 2/3/1970 5.82% -- 2/4/2002 4.55% | ||||||
| SPX Presidential Year 3 | ||||||
| Day3 | Day2 | Day1 | Day1 | Day2 | Totals | |
| 1931-3 | 0.94% 4 | 0.12% 5 | -0.62% 6 | 0.44% 1 | 0.50% 2 | 1.37% |
| 1935-3 | -0.99% 2 | 0.56% 3 | 0.78% 4 | -0.55% 5 | 0.44% 6 | 0.23% |
| 1939-3 | -0.42% 6 | 2.96% 1 | 1.15% 2 | -1.46% 3 | 2.15% 4 | 4.38% |
| 1943-3 | 0.10% 4 | 0.87% 5 | 0.29% 6 | 0.48% 1 | 0.00% 2 | 1.73% |
| 1947-3 | 1.16% 3 | -0.32% 4 | 0.38% 5 | 0.51% 6 | 0.38% 1 | 2.12% |
| 1951-3 | 0.65% 1 | 0.32% 2 | -0.37% 3 | 0.51% 4 | 0.87% 5 | 1.99% |
| 1955-3 | 0.11% 4 | 0.56% 5 | 1.22% 1 | 0.25% 2 | -0.30% 3 | 1.83% |
| 1959-3 | -1.11% 3 | 0.07% 4 | 0.40% 5 | -0.38% 1 | 0.13% 2 | -0.89% |
| 1963-3 | -0.02% 2 | -0.57% 3 | 0.53% 4 | 0.17% 5 | -0.21% 1 | -0.10% |
| Avg | 0.16% | 0.01% | 0.43% | 0.21% | 0.17% | 0.99% |
| 1967-3 | 0.41% 5 | 0.58% 1 | -0.06% 2 | -0.21% 3 | 0.35% 4 | 1.07% |
| 1971-3 | -0.73% 3 | 0.34% 4 | 0.70% 5 | 0.56% 1 | 0.01% 2 | 0.88% |
| 1975-3 | 1.62% 3 | -1.36% 4 | 1.01% 5 | 1.09% 1 | -0.27% 2 | 2.09% |
| 1979-3 | -0.30% 1 | -0.49% 2 | -1.11% 3 | 0.03% 4 | -0.46% 5 | -2.34% |
| 1983-3 | 1.93% 4 | 0.17% 5 | 0.55% 1 | -1.61% 2 | 0.19% 3 | 1.22% |
| Avg | 0.58% | -0.15% | 0.22% | -0.03% | -0.04% | 0.59% |
| 1987-3 | 0.60% 3 | -0.42% 4 | -0.06% 5 | 0.86% 1 | -0.17% 2 | 0.82% |
| 1991-3 | -0.06% 2 | 1.51% 3 | 0.89% 4 | -0.26% 5 | 1.54% 1 | 3.63% |
| 1995-3 | 0.44% 5 | -0.40% 1 | 0.41% 2 | 0.00% 3 | 0.51% 4 | 0.95% |
| 1999-3 | -0.73% 3 | 1.79% 4 | 1.12% 5 | -0.52% 1 | -0.86% 2 | 0.80% |
| 2003-3 | 0.68% 3 | -2.28% 4 | 1.31% 5 | 0.54% 1 | -1.41% 2 | -1.16% |
| Avg | 0.19% | 0.04% | 0.73% | 0.13% | -0.08% | 1.01% |
| SPX summary for Presidential Year 3 | ||||||
| Averages | 0.22% | 0.21% | 0.45% | 0.02% | 0.18% | 1.09% |
| % Winners | 58% | 63% | 74% | 58% | 58% | 79% |
| MDD 2/2/1979 2.32% -- 1/30/2003 2.28% -- 2/1/1983 1.61% | ||||||
| SPX summary for all years 1928 - 2006 | ||||||
| Averages | -0.03% | 0.25% | 0.15% | -0.18% | 0.01% | 0.19% |
| % Winners | 55% | 75% | 70% | 60% | 55% | 75% |
| MDD 2/2/1933 6.96% -- 2/3/1941 4.51% -- 2/2/1981 3.21% | ||||||
Conclusion
Most of the technical indicators are direction free. Seasonally the period has been quite strong, but seasonal influences have not had much effect on the market recently. For example, last week the S&P was down for only the 2nd time since 1953 while the mid and small cap indices were up. Right now, there is little to go on but seasonality which has been positive.
I expect the major indices to be higher on Friday February 2 than they were on Friday January 26.
This report is free to anyone who wants it, so please tell your friends. They can sign up at: http://alphaim.net/signup.html. If it is not for you, reply with REMOVE in the subject line.
Last week the major indices were split, the blue chip indices were down slightly while the small cap indices were up so I am calling last weeks positive forecast a tie.


