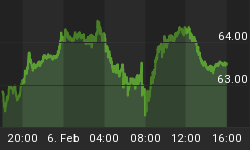
The AMEX Gold Bugs Index (HUI) closed 0.50% higher on Thursday, Feb. 22, to finish the day at 356.34 while the XAU was 0.16% higher at 146.05. The spot gold index closed at $379 while spot silver closed Thursday at $14.22.
In my Feb. 5 commentary on the natural resource stocks I wrote, "Although some of the XAU's price oscillators are slowly inching into positive territory and are no longer 'oversold,' the primary consideration right now isn't overbought versus oversold. It's the strongly rising internal momentum from a 90-day rate of change standpoint. The indicator known as GS HILMO is showing us that the dominant interim momentum for the gold and silver stock groups is strongly positive right now." That comment was the key to the anticipated strong performance in the gold/silver stock sector as well as the realization of our prediction that the December highs in the XAU and HUI indices would be reached and possibly exceeded.
Note the still positive configuration of the 30/60/90-day internal momentum indicators for the gold stock sector shown below. This is the pattern I've been referring you to for the past several weeks and is the main reason why the gold/silver stocks have performed well since mid-January.

That prediction has technically already been fulfilled in the Amex Gold Bugs Index (HUI) as the index briefly touched the 360 area on Thursday before pulling back slightly to close at 356. But HUI should still be able to lift above the 360 level and make a new high for the year before the rising internal momentum peaks out. The 30-day moving average for HUI is about to penetrate above the 60-day MA and this usually confirms an upside breakout above the nearest resistance, which in this case is the 360 level.

The silver stocks have been outperforming of late which served as a proxy for the strength we're now seeing in the gold stocks. I mentioned last time that whenever we see white metal stocks like PAAS, SSRI and Platinum Group Metals (PTM:TSX) leading the way higher it sends a very positive vibe for the overall precious metals sector that's hard to ignore. It nearly always leads to the gold stock group following higher since silvers and platinums usually lead the golds.
I also mentioned that heading into February the month ahead would likely be a volatile, rocky one at times due to the fact that the 120-day gold stock momentum indicator was down, while the 90-day momentum indicator was up strongly. (The 120-day momentum indicator is important since it represents the dominant intermediate-term rate of change within the market). These cross-currents have been responsible for what we've seen in the XAU to date. But as noted in the previous commentary, the 90-day momentum indicator takes precedence over 120-day momentum in the near term and the XAU was and is still expected to gradually make further headway upward this month in spite of days like Tuesday, Feb. 20 (which we can expect to see from time to time).
Below is a chart which compares the 120-day internal momentum indicators for the oil stocks and the gold stocks. From the start of January through the middle part of February the oil stock 120-day momentum indicator had a distinct downward bias but as you can see in the chart below it's starting to flatten out. Meanwhile, the gold stock 120-day momentum (red line) has already bottomed and is gradually turning up as of this writing. The good news is that the 120-day momentum indicators for both the oil stocks and the gold stocks is expected to accelerate to the upside beginning in early March and remain upward through the bulk of that month.

The oil stock sector as represented by the Amex Oil Index (XOI) should be able to benefit from this anticipated reversal in momentum. It should finally allow the XOI to break out above the 1,180 resistance level that has kept the index trapped in a lateral trading range since late January. It should also allow XOI to test its previous high made in December at 1,240.
We noted previously that the natural gas stock sector has rally potential in the near term based on internal considerations as well as seasonal factors. According to Stock Trader's Almanac, February is historically bullish for the natural gas stocks. The Amex Natural Gas Index (XNG) closed Thursday, Feb. 22, at just below the 462 level, a near term resistance. After the corrective past two weeks' consolidation, XNG should be able to carry forward to the 470-475 resistance area where the previous high was made in December. Among the leading oil/gas equities we mentioned earlier this month as having bullish chart outlooks, Valero Energy (VLO) and XTO Energy (XTO) have made higher highs with XTO breaking out to a new all-time high on Thursday. Be sure and take some profits on these equities and raise stops along the way.
**********
Ode to Momentum
"It's all in the fundamentals,"
is what the Wall Streeters will say.
That's the mantra they love to chant,
on CNBC every day.
Others take the technical view:
a few chart pattern here and there;
They love those head and shoulders,
and can see them everywhere.
Momentum is the best approach:
though some may find it quite strange.
The answer's not in the numbers,
but it's in the rate of change.


