


3/31/2007 11:53:48 AM
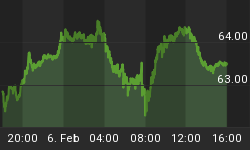
The Qs action on Friday created a long legged/shadowed doji. Here's what it means.

Stock Barometer Analysis
The barometer remains in Sell Mode. Both the Bulls and the Bears had their share of power plays during trading on Friday, swinging the price in each direction. At the close, the power was basically equal, and the day formed a doji candle.

The Stock Barometer is my proprietary market timing system. The direction or slope of the Stock Barometer helps determine our outlook on the market's direction. For example, if the barometer line is moving down, we are in Sell Mode. A Buy or Sell Signal is triggered when the indicator clearly changes direction. The black line is a 5 day moving average of the barometer and may be used to confirm changes in direction. All the information contained in this email is considered in making our calls.
Stock Barometer Cycle Time
Monday will be day 4 in our down cycle.
The Stock Barometer signals follow 5, 8, 13, 21 and sometimes 34 day Fibonacci cycles that balance with 'normal' market cycles. Knowing where you are in the current market cycle is important in deciding how long you expect to maintain a position.
Potential Cycle Reversal Dates
2007 Potential Reversal Dates: 1/10, 1/14, 1/27, 1/31, 2/3, 2/17, 3/10, 3/24, 4/21, 5/6. We publish these dates up to 2 months in advance.
We are moving sideways in a consolidation, but I'm still prognosticating the Qs to break lower as we approach our 4/21 reversal date.
My Additional timing work is based on numerous cycles and has resulted in the above potential reversal dates. These are not to be confused with the barometer cycle times. However, due to their accuracy I post the dates here. These dates are used to influence how quickly we issue a buy or sell signal.
2006 potential reversal dates: 1/16, 1/30, 2/25, 3/19, 4/8, 5/8, 5/19, 6/6(20), 7/24, 8/20, 8/29, 9/15, 10/11, 11/28. 2005 Potential reversal dates based on 'other' cycle work were 12/27, 1/25, 2/16, 3/4, 3/14, 3/29, 4/5, 4/19, 5/2, 6/3, 6/10, 7/13, 7/28, 8/12, 8/30-31, 9/22, 10/4, 11/15, 11/20, 12/16.
The following work is based on my spread/momentum indicators for the QQQQ, SPY, XAU, GLD and TLT. They are tuned to deliver signals in line with the Stock Barometer and we use them only in determining our overall outlook for the market and for pinpointing market reversals. I provide the spread indicator charts at least weekly and when they deliver reversal signals. The level, direction, and position to the zero line are keys in these indicators. For example, direction determines mode and a buy signal 'above zero' is more bullish than a buy signal 'below zero'.
QQQQ & SPY Spread Indicator
The QQQQ and SPY Spread Indicators remain in Sell Mode, above zero.


The QQQQ and SPY Spread Indicators will yield their own buy and sell signals and may be in Buy and Sell Mode that is different from the Stock Barometer.
Gold & Silver Sector Index Spread Indicator (Index:XAU.X)
The XAU and Gold Spread Indicators remain in Sell mode, above zero.


The dollar Spread Indicator remains in Buy Mode, below zero.

I monitor Gold in the form of GLD and the XAU as well as the US Dollar Index as a general guide to the overall health of the US Economy and the markets, as well as to assist us in the entry of positions in our Gold Stock Service.
Bonds Spread Indicator (AMEX:TLT)
The Bond Spread Indicator remains in Buy Sell Mode, above below zero.

I include bonds in our studies and use Lehman's 20 year ETF, as the direction of bonds can have an impact on the stock market. Normally, as bonds go down, stocks will go up and as bonds go up, stocks will go down.
Supporting Secondary Chart

I have over 100 technical indicators, some that are widely followed and some that are proprietary. These indicators break down the market internals, sentiment and money flow and give us unique insight into the market. I feature at least one here each day in support of our current outlook.
Summary of Daily Outlook
We remain in Sell Mode as we look for the Qs to continue in this consolidation before breaking lower into late April. As for upside action, the market has established a down trend from the 2/26 high so that down trend would have to break in order to retest the gap at 44.50. However, since the Qs have already retraced 62% of the previous advance, it is unlikely that the market will be able to break above the bearish gap from 2/27. If the market continues to consolidate before breaking last Thursday's low, a move down to 42.50 is likely and a move down to 41.70 would be the extreme expectation for the downward move of this leg.

As always, if you have any questions or comments, feel free to email me at Jay@stockbarometer.com.
Regards,


