


(Econotech FHPN)--Due to my ongoing concerns about the global financial markets at the current time, I've been posting more frequently the past month than I feel comfortable doing. I hope that I am not becoming too short-term oriented as a result.
Emerging markets have been a clear focus of public equity market speculation in the 2002-07 cycle (there's much larger speculation in private equity, structured finance and derivative markets). In this respect, EEM, MSCI emerging market etf, is the QQQQ, Nasdaq 100, of this cycle.
Perhaps with the critical difference that EEM's p/e is now actually over an order of magnitude lower than Nasdaq's in March 2000 (I know that seems difficult to believe in retrospect, especially given how "efficient" developed markets' are claimed to be).
I showed in my last June 21 article (""Goldilocks" 65 Basis Pts Higher," link) that EEM is now 2 standard deviations over its 4-year linear regression trend. Much shorter-term, over the past month since May 23, EEM has started to exhibit greater volatility.
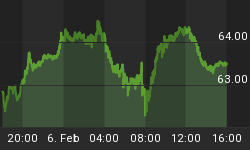
You can see that on the attached 60-day, 60 min chart, courtesy of prophet.net (left click once to enlarge).

Before May 23, EEM prices hugged the center green regression line. After May 23, these prices have been yo-yo-ing up and down. You also can see the same thing in the "true strength index" panel, with the greater oscillations around the 0 line.
To me, this chart is a warning sign, for the following reason. Over this short-term period, reward, in this case the rate of price change, essentially the slope of the regression line, hasn't changed. Yet risk, indicated by the greater volatility (larger standard deviation of prices), is increasing.
So, EEM most recently is generating the same return, but now at higher risk. I.e., risk-adjusted return is going down, especially when you add in the additional factor of the higher hurdle of rising l-t interest rates.
Perhaps this declining risk-adjusted return may seem a somewhat subtle change if one is mainly focused on return. But I believe that when a market starts giving the same return for higher risk, it's time to start taking notice.
To be crystal clear, I am NOT predicting here imminent meaningful declines in the emerging markets, though I think the risks of that have been increasing. E.g, perhaps July might have its typical seasonal bounce, with declines to then follow.
But to continue the analogy from my June 7 article ("Equity Markets Flying Without Instruments Into a Non-Linear Storm", link), I do think there are subsurface cracks in the ice.
In that article, I showed a chart of XBD, the broker-dealer index, with a negative alpha (risk-adjusted return) since July 2006, saying that didn't seem like a good sign for a global financial economy seemingly run for and by the Goldman Sachs' and Blackstones' of the world.
I-bank stocks have been weaker since I posted that due to concerns about the Bear Stearns hedge fund situation (see my June 21 ""Goldilocks"" article link).
Here is a 4-year weekly chart of another financial sector, RKH, regional bank etf, courtesy of prophet.net (left click one to enlarge).

Similar to XBD, RKH's alpha is negative, in the latter case at the lowest level of the past four years.
It's a little difficult to see, but RKH is now below its 40-week moving average (purple line) and right near the bottom (2 std deviations) of its linear regression channel. Both served as support in Oct 2005, failure to do so again would be significant this time.
So the signs, "Warning Thin Ice," continue to add up. Perhaps the darkest hour is just before dawn. Wall Street is probably hoping for the usual first month of the quarter bounce in July during earnings reporting season.
But perhaps these increasing warning signs mean there may be more darkness to come. That's why I've recently suggested considering hedging one's bets in the most appropriate manner for each investor.
I think most people naturally would prefer not to hear such warnings and suggestions, and I'd prefer not to make them. But no one likes losing money either, so perhaps at selected times it may be worth running the risk to one's credibility by making them.


