


The good news is:
• The Fed lowered both the discount rate and the fed funds rate by ½% last Tuesday.
Short Term
In the past two weeks the market has advanced as much as any other two week period in the past year.
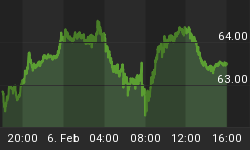
The chart below covers the past 6 months showing the S&P 500 (SPX) in red and the 10 trading day Rate Of Change (ROC) of the SPX in purple.
By this measure the market is overbought.

Intermediate Term
In his book "Winning On Wall Street", Martin Zweig told us "Don't fight the fed". The fed indicator which was derived from trends in the discount rate implied when interest rates were falling the equities were likely to rise and when interest rates were rising equities were likely to fall. The indicator worked pretty well until 1999. When Zweig did his research in the 1960's the Fed Funds rate was virtually unknown while the Discount rate was widely published. For the past 20 years or so the Fed Funds rate has become the more popular interest rate barometer.
Don't fight the fed has not been the imperative command it once was.
At the market low on October 7, 1998 the Fed Funds rate was 5.05%, the NASDAQ composite (OTC) closed at 1462 and the SPX closed at 970.
At the market top March 10, 2000 the Fed Funds rate was 5.74%, the OTC closed at 5048 and the SPX closed at 1395.07 six points off its then all time high of 1401 set the day before.
When the market bottomed on July 23, 2002 the Fed Funds rate had fallen to 1.75%, the OTC closed at 1229 and the SPX closed at 797.
When Fed funds reached their low of 1% on June 25, 2003 the OTC had climbed 30% to 1602 and the SPX was up 22% to 975.
The fed began raising rates on July 12, 2004, OTC closed at 1936 and the SPX closed at 1114.
The fed raised rates for the next 2 years finishing with the Fed Funds at 5.25% on June 30, 2006 on that date the OTC closed at 2172 up 12% since the 1st rate hike and the SPX closed at 1270 up 14%.
Aside from the reactions that last for a few days following a change in rates the intermediate term effect of interest rate changes on equity prices, for the past 10 years, has been the opposite of what has become conventional wisdom. That is, for the past 10 years it has paid to fight the fed.
During the 2000 - 2002 bear market equity prices usually responded positively, sometimes violently, to cuts in the Fed Funds rate.
Here are a few examples:
On 1/3/2001 the Fed Funds rate was cut 0.5% from 6.5% to 6.0%.
The OTC jumped 14% on that day to 2616 and hit its high for the move of 2859 several weeks later on 1/24/01. At the same time the SPX rose 5% to 1347 and also hit its high of 1349 on 1/24/01.
On 2/1/2001 the Fed Funds rate was cut 0.5% to 5.5%.
On that day the OTC fell 1.9% to 2660 and the SPX fell 1.6% to 1349.
On 3/22/2001 the Fed Funds rate was cut 0.5% to 5.0%.
On that day the OTC rose 1.6% to 1928 and the SPX was up 1.9% to 1139. 5 days later on 3/27 they both hit their short term highs at 1972 for the OTC and 1182 for the SPX.
On 4/19/2001 the Fed Funds rate was cut 0.5% to 4.5%.
On that day the OTC rose 13% to 2182 and the SPX rose 5% to 1253.
Both hit their highs for the move a few days later on 5/2/01 at 2220 for the OTC and 1267 for the SPX.
During the 2000 - 2002 bear market rate cuts often sparked violent, but, short lived rallies. The 3% - 5% rally sparked by the Fed Funds rate cut last Tuesday was anemic compared to the rally following the 1st rate cut during the 2000 - 2002 bear market.
Zweig's research was first published in the late 1960's prior to the closing of the gold window in 1973. The lack of intrinsic backing for the dollar has brought a degradation of monetary discipline and allowed the Fed to become preemptive rather than reactive.
Seasonality
Next week can be viewed from two slightly different perspectives.
It is the last 5 trading days of September during the 3rd year of the Presidential Cycle and the week following options and futures expiration.
There are two sets of tables.
The first shows the last 5 trading days in September during the 3rd year of the Presidential Cycle. OTC data covers the period from 1963 - 2003 and SPX data from 1928 - 2003. There are summaries for both the 3rd year of the Presidential Cycle and all years combined.
The second set of tables show the daily change of the indices during the week following the 3rd Friday in September. OTC data covers the period from 1963 - 2003 and SPX data from 1953 - 2003. There are summaries for both the 3rd year of the Presidential Cycle and all years combined. Prior to 1953 the market traded 6 days a week so that data has been ignored.
Any way you look at it, next week is not pretty.
Last 5 days of September
The number following the year represents its position in the presidential cycle.
The number following the daily return represents the day of the week;
1 = Monday, 2 = Tuesday etc.
| OTC Presidential Year 3 | ||||||
| Day 5 | Day4 | Day3 | Day2 | Day1 | Totals | |
| 1963-3 | -0.37% 2 | -0.34% 3 | -0.71% 4 | -0.49% 5 | -0.23% 1 | -2.13% |
| 1967-3 | 0.19% 1 | 0.18% 2 | -0.32% 3 | 0.18% 4 | 0.08% 5 | 0.31% |
| 1971-3 | 0.07% 5 | -0.64% 1 | 0.18% 2 | 0.20% 3 | 0.40% 4 | 0.21% |
| 1975-3 | 0.65% 3 | -0.43% 4 | 0.05% 5 | -1.01% 1 | -1.38% 2 | -2.13% |
| 1979-3 | -0.35% 1 | -0.57% 2 | 0.41% 3 | 0.33% 4 | -0.26% 5 | -0.44% |
| 1983-3 | 0.05% 1 | -0.98% 2 | -0.34% 3 | -0.16% 4 | -0.88% 5 | -2.31% |
| Avg | 0.12% | -0.49% | 0.00% | -0.09% | -0.41% | -0.87% |
| 1987-3 | 0.12% 4 | 0.15% 5 | 0.09% 1 | -0.10% 2 | 0.55% 3 | 0.81% |
| 1991-3 | 0.34% 2 | 0.26% 3 | -0.17% 4 | -0.47% 5 | 0.46% 1 | 0.42% |
| 1995-3 | -0.68% 1 | -0.77% 2 | -1.12% 3 | 2.01% 4 | -0.34% 5 | -0.91% |
| 1999-3 | -0.34% 5 | 0.78% 1 | -0.20% 2 | -0.94% 3 | 0.58% 4 | -0.12% |
| 2003-3 | -3.05% 3 | -1.44% 4 | -1.39% 5 | 1.81% 1 | -2.06% 2 | -6.12% |
| Avg | -0.72% | -0.21% | -0.55% | 0.46% | -0.16% | -1.18% |
| OTC summary for Presidential Year 3 1963 - 2003 | ||||||
| Averages | -0.31% | -0.35% | -0.32% | 0.12% | -0.28% | -1.13% |
| % Winners | 55% | 36% | 36% | 45% | 45% | 36% |
| MDD 9/30/2003 6.04% -- 9/30/1975 2.75% -- 9/27/1995 2.55% | ||||||
| OTC summary for all years 1963 - 2006 | ||||||
| Averages | -0.08% | -0.05% | -0.20% | 0.03% | -0.12% | -0.42% |
| % Winners | 57% | 51% | 45% | 49% | 50% | 48% |
| MDD 9/30/1974 6.69% -- 9/30/2003 6.04% -- 9/27/1990 5.81% | ||||||
| SPX Presidential Year 3 | ||||||
| Day 5 | Day4 | Day3 | Day2 | Day1 | Totals | |
| 1931-3 | 2.25% 5 | -1.74% 6 | -2.14% 1 | -4.19% 2 | -3.48% 3 | -9.31% |
| 1935-3 | 0.43% 3 | 0.00% 4 | -0.26% 5 | 0.09% 6 | 0.17% 1 | 0.43% |
| 1939-3 | 1.24% 2 | 0.00% 3 | -1.91% 4 | -0.54% 5 | 1.80% 6 | 0.58% |
| 1943-3 | -0.08% 6 | -0.74% 1 | -0.17% 2 | 0.25% 3 | 0.58% 4 | -0.16% |
| 1947-3 | 0.40% 3 | -0.60% 4 | -0.34% 5 | 0.61% 1 | 1.14% 2 | 1.21% |
| 1951-3 | -0.43% 1 | 0.34% 2 | 0.09% 3 | -0.56% 4 | -0.04% 5 | -0.60% |
| 1955-3 | -6.62% 1 | 2.28% 2 | 1.68% 3 | -0.63% 4 | -0.82% 5 | -4.12% |
| 1959-3 | 1.72% 4 | -0.09% 5 | 0.74% 1 | 0.63% 2 | -1.10% 3 | 1.91% |
| 1963-3 | 0.47% 2 | -0.56% 3 | -0.85% 4 | -0.19% 5 | -0.60% 1 | -1.73% |
| Avg | -0.89% | 0.27% | 0.26% | -0.03% | -0.28% | -0.67% |
| 1967-3 | 0.61% 1 | -0.85% 2 | 0.03% 3 | 0.00% 4 | -0.08% 5 | -0.29% |
| 1971-3 | -0.23% 5 | -0.54% 1 | 0.27% 2 | 0.02% 3 | 0.45% 4 | -0.04% |
| 1975-3 | 0.94% 3 | -0.12% 4 | 0.64% 5 | -1.35% 1 | -1.36% 2 | -1.24% |
| 1979-3 | -0.78% 1 | 0.06% 2 | 0.26% 3 | 0.23% 4 | -0.81% 5 | -1.04% |
| 1983-3 | 0.33% 1 | -0.96% 2 | -0.25% 3 | -0.46% 4 | -0.69% 5 | -2.04% |
| Avg | 0.17% | -0.48% | 0.19% | -0.31% | -0.50% | -0.93% |
| 1987-3 | -0.46% 4 | 0.14% 5 | 0.95% 1 | -0.47% 2 | 0.04% 3 | 0.21% |
| 1991-3 | 0.46% 2 | -0.21% 3 | -0.10% 4 | -0.15% 5 | 0.51% 1 | 0.50% |
| 1995-3 | 0.01% 1 | -0.07% 2 | -0.06% 3 | 0.83% 4 | -0.25% 5 | 0.46% |
| 1999-3 | -0.27% 5 | 0.46% 1 | -0.09% 2 | -1.08% 3 | 1.13% 4 | 0.16% |
| 2003-3 | -1.91% 3 | -0.61% 4 | -0.64% 5 | 0.98% 1 | -1.05% 2 | -3.23% |
| Avg | -0.43% | -0.06% | 0.01% | 0.02% | 0.08% | -0.38% |
| SPX summary for Presidential Year 3 1931 - 2003 | ||||||
| Averages | -0.10% | -0.20% | -0.11% | -0.32% | -0.23% | -0.96% |
| % Winners | 58% | 26% | 42% | 42% | 42% | 42% |
| MDD 9/30/1931 11.08% -- 9/26/1955 6.62% -- 9/30/2003 3.21% | ||||||
| SPX summary for all years 1928 - 2006 | ||||||
| Averages | -0.22% | -0.12% | 0.08% | -0.14% | -0.05% | -0.44% |
| % Winners | 49% | 47% | 56% | 53% | 47% | 52% |
| MDD 9/30/1931 11.08% -- 9/30/1974 8.47% -- 9/30/1930 7.56% | ||||||
| *********************************************************** | ||||||
Report for the week before the 4th Friday of September
The number following the year is the position in the presidential cycle.
Daily returns from Monday through the 4th Friday.
| OTC Presidential Year 3 | ||||||
| Year | Mon | Tue | Wed | Thur | Fri | Totals |
| 1963-3 | -0.06% | -0.37% | -0.34% | -0.71% | -0.49% | -1.95% |
| 1967-3 | 0.19% | 0.34% | 0.20% | -0.08% | 0.35% | 1.00% |
| 1971-3 | -0.10% | -0.15% | -0.76% | -0.17% | 0.07% | -1.11% |
| 1975-3 | -0.69% | 0.11% | 0.65% | -0.43% | 0.05% | -0.32% |
| 1979-3 | -0.35% | -0.57% | 0.41% | 0.33% | -0.26% | -0.44% |
| 1983-3 | 3.21% | -1.45% | -0.03% | 0.43% | -0.31% | 1.84% |
| Avg | 0.45% | -0.35% | 0.09% | 0.01% | -0.02% | 0.19% |
| 1987-3 | -1.10% | 0.43% | 0.64% | 0.12% | 0.15% | 0.24% |
| 1991-3 | -0.47% | 0.34% | 0.26% | -0.17% | -0.47% | -0.51% |
| 1995-3 | -0.09% | 0.96% | 0.45% | -0.62% | -0.48% | 0.23% |
| 1999-3 | 0.57% | -2.25% | 1.32% | -3.79% | -0.34% | -4.50% |
| 2003-3 | -1.63% | 1.45% | -3.05% | -1.44% | -1.39% | -6.06% |
| Avg | -0.54% | 0.19% | -0.08% | -1.18% | -0.51% | -2.12% |
| OTC summary for Presidential Year 3 1963 - 2003 | ||||||
| Avg | -0.05% | -0.11% | -0.02% | -0.59% | -0.28% | -1.05% |
| Win% | 27% | 55% | 64% | 27% | 36% | 36% |
| OTC summary for all years 1963 - 2006 | ||||||
| Avg | -0.23% | -0.01% | 0.12% | -0.37% | -0.20% | -0.69% |
| Win% | 40% | 52% | 59% | 36% | 50% | 43% |
| SPX Presidential Year 3 | ||||||
| Year | Mon | Tue | Wed | Thur | Fri | Totals |
| 1955-3 | 0.16% | -0.07% | 0.58% | 0.00% | 0.53% | 1.19% |
| 1959-3 | -1.46% | -0.24% | 1.23% | 1.72% | -0.09% | 1.17% |
| 1963-3 | -0.46% | 0.47% | -0.56% | -0.85% | -0.19% | -1.60% |
| 1967-3 | 0.27% | -0.37% | -0.04% | 0.64% | 0.26% | 0.76% |
| 1971-3 | -0.28% | -0.34% | -0.88% | -0.09% | -0.23% | -1.82% |
| 1975-3 | -0.94% | -0.15% | 0.94% | -0.12% | 0.64% | 0.37% |
| 1979-3 | -0.78% | 0.06% | 0.26% | 0.23% | -0.81% | -1.04% |
| 1983-3 | 0.83% | 0.97% | -0.50% | 0.80% | -0.15% | 1.96% |
| Avg | -0.18% | 0.03% | -0.04% | 0.29% | -0.06% | 0.05% |
| 1987-3 | -1.37% | 2.89% | 0.53% | -0.46% | 0.14% | 1.72% |
| 1991-3 | -0.52% | 0.46% | -0.21% | -0.10% | -0.15% | -0.52% |
| 1995-3 | -0.10% | 0.25% | 0.44% | -0.64% | -0.22% | -0.27% |
| 1999-3 | 0.01% | -2.10% | 0.22% | -2.27% | -0.27% | -4.39% |
| 2003-3 | -1.30% | 0.61% | -1.91% | -0.61% | -0.64% | -3.85% |
| Avg | -0.65% | 0.42% | -0.19% | -0.81% | -0.23% | -1.46% |
| SPX summary for Presidential Year 3 1955 - 2003 | ||||||
| Avg | -0.46% | 0.19% | 0.01% | -0.14% | -0.09% | -0.49% |
| Win% | 31% | 54% | 54% | 33% | 31% | 46% |
| SPX summary for all years 1953 - 2006 | ||||||
| Avg | -0.40% | 0.03% | 0.01% | -0.22% | -0.20% | -0.77% |
| Win% | 33% | 51% | 55% | 37% | 40% | 37% |
Mutual Fund
Compliance issues demand that I not mention the mutual fund that I manage by name or symbol in this letter.
To see a current chart of the fund go to: http://finance.yahoo.com/q/bc?s=APHAX&t=6m&l=on&z=m&q=l&c=.
For information about the fund go to: http://www.thealphafunds.com/index.htm.
The fund now has service class shares available.
Conclusion
All of the major indices were at multi year or all time highs in late July. Less than a month later we saw near record numbers of new lows. Last week we had an interest rate cut while the most of the major indices were less than 5% from their all time highs. These are unusual times.
I expect the major indices to be lower on Friday September 28 than they were on Friday September 21.
This report is free to anyone who wants it, so please tell your friends. They can sign up at: http://alphaim.net/signup.html. If it is not for you, reply with REMOVE in the subject line.
Last weeks negative forecast was a miss.


