


Market Wrap
Week Ending 1/25/08
Gold
When all was said and done, after the dust had settled, and sanity returned to the pits, gold gained $29 for the week to close at a new all time high of $910.70 (+3.9%).
It was not, however, a one way street. At one point during trading on Tuesday gold hit a low of $849.50 for an intra-week swing of over 7%.
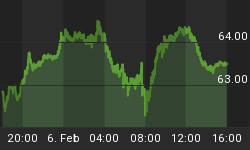
Gold registered new highs in several different currencies. Below are the charts of gold priced in U.S. dollars and euros. Both currency denominated prices made new highs.
An interesting development, besides the emergency cut in interest rates by the Fed, and the rogue trader at Societe Generale that some how went undetected, until the other day, for over $7 billion dollars worth of losses - is the NYMEX's decision to raise gold futures margins. Throw these three into a pot and the concoction is a strange brew worthy of Macbeth.
We will not bore the reader with the details, suffice it to say margins were raised and can be read about on Reuters or Bloomberg or wherever. The same holds true for the Fed's rate cut and France's tale of woe. It is nonetheless curious - who knew what and when?

Gold in Dollars

Gold in Euros
The P&F chart of gold shows a double top breakout on January 23, 2008, with a price projection of $1,065.00.

GLD
The daily chart of streetTRACKS Gold Trust (GLD) shows one continuous bull market move higher, which rises from the lower left hand corner of the chart to the upper right hand corner.
Notice how it moves higher and then consolidates and then moves higher again - relentlessly.
MACD has crossed over into positive territory as have the histograms. Volume, however, decreased.

Silver
Silver gained 0.27 cents to close at $16.49 (+1.70%). This past week gold was up about twice as much as silver, whereas the week before silver gained twice as much as gold.
The daily silver chart below shows one consolidation after another, and a continuous move higher. Following the daily chart is a P&F chart that has a bullish price objective of $25.50.


Hui
The Hui had a good week, forging ahead 24.72 points to close at 461.52 for a +5.66% gain.
As with gold's advance for the week, it was not all a one-way street. On Tuesday the Hui fell to a low of 415.35 for close to a 15% intra-week swing.
MACD appears to be setting up for a positive cross over, and histograms are receding back towards zero. RSI looks as if it may be rolling over. Mixed signals are present.

The weekly Hui chart also has mixed signals. A well defined upward sloping channel is present. Horizontal support comes in around 400.
MACD remains strong, and the histograms may be flattening out. STO also appears to be curling over and setting up for a negative cross.
A few days of positive or negative price action would easily move the indicators accordingly.

The P&F chart for the Hui suggests a bit of a different story. It shows a low pole reversal on January 24, 2008. This suggests that buying power may be waning.
A bearish price objective exists for 340, which is over 25% below the current close at 461.58. Ouch! But the GDX P&F shows a bullish price projection 58% above current levels. Which chart to pick?


Come visit our new website: Honest Money Gold & Silver Report
New Book Coming in 2008 - Honest Money


