


The good news is:
• In the past week new lows dried up on both the NYSE and OTC this implies downside risk will be limited for the next several weeks.
Short Term
Last Tuesday there were 1114 new lows on the NYSE and 877 on the NASDAQ, some of the highest numbers ever recorded. On Friday, a down day, there were 35 new lows on the NYSE and 68 on the NASDAQ. The extremely high numbers on Tuesday imply the bear market is not over while the rapid reduction of new lows implies downside risk will be limited for the next few weeks or months.
New lows and downside volume are the two best bottom indicators and they are giving conflicting messages.
The chart below covers the past 3 months showing the NASDAQ composite (OTC) in red, a 4% trend (39 day EMA) of NASDAQ downside volume (DV) in green and a 10% trend (19 day EMA) of NASDAQ new lows (NL) in blue. Both NL and DV have been plotted on an inverted Y axis so diminishing numbers move the indicators upward (up is good). Dashed vertical lines have been drawn on the 1st trading day of each month.
NL continued to move sharply upward on Friday as the OTC declined while DV moved downward along with the index.

The next chart is similar to the one above except is shows the lows of last August.
NL began moving upward after the early August low and was higher when the index made a lower low near mid August. DV did not begin moving upward until after the mid August retest.

The relatively undiminished level of downside volume suggests there will be a retest of Monday's low while the sharp decline in new lows suggest down side risk is limited.
Intermediate Term
Last Tuesday there were 877 new lows on the NASDAQ. During the 2000 - 2002 bear market the highest number recorded was 788 on 12/20/2000 fairly early in that bear market.
The chart below covers the past 5 years showing the OTC in blue and OTC NL in red. Dashed vertical lines have been drawn on the 1st trading day of each year.

The next chart shows the OTC and OTC NL during the bear market of 2000 - 2002 and the recovery into early 2004.

If similar patterns evolve, we are in the early stages of a bear market.
Seasonality
Next week includes the last 4 trading days of January and the 1st trading day of February during the 4th year of the Presidential Cycle.
The tables show the daily change of the OTC and SPX during the week in the 4th year of the Presidential Cycle. OTC data covers the period from 1964 - 2004 and SPX data from 1928 - 2004. There are summaries for both the 4th year of the Presidential Cycle and all years combined.
The week has had a modestly positive bias during most years, however, it has been a little weaker during the 4th year of the Presidential Cycle.
Report covering the last 4 days of January and first 1 day of February.
The number following the year represents its position in the presidential cycle.
The number following the daily return represents the day of the week;
1 = Monday, 2 = Tuesday etc.
| OTC Presidential Year 4 | ||||||
| Day4 | Day3 | Day2 | Day1 | Day1 | Totals | |
| 1964-4 | -0.16% 2 | 0.27% 3 | -0.35% 4 | 0.00% 5 | 0.25% 1 | 0.00% |
| 1968-4 | -0.34% 5 | 0.50% 1 | 0.35% 2 | -0.86% 3 | -0.47% 4 | -0.83% |
| 1972-4 | 0.08% 3 | 0.84% 4 | 0.91% 5 | 0.36% 1 | 0.60% 2 | 2.79% |
| 1976-4 | -0.34% 2 | -0.15% 3 | 1.80% 4 | 1.04% 5 | 0.26% 1 | 2.61% |
| 1980-4 | 0.63% 1 | -0.26% 2 | 0.63% 3 | 0.28% 4 | 0.34% 5 | 1.62% |
| 1984-4 | -0.63% 4 | -0.88% 5 | -1.45% 1 | -0.30% 2 | -0.75% 3 | -4.00% |
| Avg | -0.12% | 0.01% | 0.45% | 0.10% | 0.00% | 0.44% |
| 1988-4 | -0.38% 2 | 0.17% 3 | 0.75% 4 | 0.67% 5 | 0.45% 1 | 1.66% |
| 1992-4 | 0.05% 2 | -0.80% 3 | 0.82% 4 | -0.19% 5 | 0.52% 1 | 0.40% |
| 1996-4 | 0.48% 5 | 0.14% 1 | 0.84% 2 | 0.81% 3 | 0.92% 4 | 3.19% |
| 2000-4 | -2.34% 3 | -0.74% 4 | -3.78% 5 | 1.37% 1 | 2.83% 2 | -2.66% |
| 2004-4 | -1.75% 2 | -1.83% 3 | -0.44% 4 | -0.10% 5 | -0.15% 1 | -4.27% |
| Avg | -0.79% | -0.61% | -0.36% | 0.51% | 0.91% | -0.33% |
| OTC summary for Presidential Year 4 1964 - 2004 | ||||||
| Averages | -0.43% | -0.25% | 0.01% | 0.28% | 0.44% | 0.05% |
| % Winners | 36% | 45% | 64% | 55% | 73% | 64% |
| MDD 1/28/2000 6.73% -- 2/2/2004 4.21% -- 2/1/1984 3.94% | ||||||
| OTC summary for all years 1963 - 2007 | ||||||
| Averages | 0.17% | 0.05% | 0.11% | 0.31% | 0.18% | 0.81% |
| % Winners | 60% | 59% | 62% | 67% | 66% | 62% |
| MDD 1/28/2000 6.73% -- 2/2/1970 6.34% -- 2/2/2004 4.21% | ||||||
| SPX Presidential Year 4 | ||||||
| Day4 | Day3 | Day2 | Day1 | Day1 | Totals | |
| 1928-4 | 0.34% 5 | -0.62% 6 | -0.51% 1 | 0.46% 2 | -0.23% 3 | -0.56% |
| 1932-4 | -1.93% 3 | -1.47% 4 | -1.12% 5 | -0.63% 6 | 4.31% 1 | -0.84% |
| 1936-4 | 0.14% 2 | 1.00% 3 | -0.49% 4 | 1.63% 5 | -0.07% 6 | 2.21% |
| 1940-4 | 0.08% 6 | 0.00% 1 | -0.58% 2 | -0.33% 3 | 0.00% 4 | -0.82% |
| 1944-4 | -0.17% 4 | 0.60% 5 | 0.00% 6 | 0.34% 1 | -0.17% 2 | 0.60% |
| Avg | -0.31% | -0.10% | -0.54% | 0.29% | 0.77% | 0.12% |
| 1948-4 | 1.05% 3 | 1.10% 4 | 0.20% 5 | 0.07% 6 | 0.14% 1 | 2.56% |
| 1952-4 | 0.08% 1 | -0.16% 2 | -1.38% 3 | -0.37% 4 | 0.66% 5 | -1.17% |
| 1956-4 | -0.59% 4 | -0.25% 5 | 0.35% 1 | 0.74% 2 | 0.48% 3 | 0.71% |
| 1960-4 | 0.14% 2 | -0.25% 3 | -1.04% 4 | -0.93% 5 | 0.63% 1 | -1.44% |
| 1964-4 | 0.03% 2 | -0.61% 3 | 0.09% 4 | 0.44% 5 | -0.09% 1 | -0.14% |
| Avg | 0.14% | -0.03% | -0.36% | -0.01% | 0.36% | 0.10% |
| 1968-4 | 0.16% 5 | -0.11% 1 | -0.49% 2 | -0.70% 3 | 0.35% 4 | -0.79% |
| 1972-4 | -0.27% 3 | 0.98% 4 | 0.64% 5 | -0.21% 1 | 0.07% 2 | 1.20% |
| 1976-4 | -0.61% 2 | -0.55% 3 | 1.60% 4 | 0.75% 5 | 0.01% 1 | 1.21% |
| 1980-4 | 1.09% 1 | -0.68% 2 | 0.99% 3 | -0.90% 4 | 0.84% 5 | 1.34% |
| 1984-4 | -0.36% 4 | -0.18% 5 | -0.65% 1 | 0.33% 2 | -0.41% 3 | -1.28% |
| Avg | 0.00% | -0.11% | 0.42% | -0.15% | 0.17% | 0.33% |
| 1988-4 | -1.03% 2 | -0.08% 3 | 1.57% 4 | 1.49% 5 | -0.79% 1 | 1.16% |
| 1992-4 | -0.01% 2 | -1.11% 3 | 0.31% 4 | -0.69% 5 | 0.18% 1 | -1.32% |
| 1996-4 | 0.74% 5 | 0.42% 1 | 0.95% 2 | 0.93% 3 | 0.38% 4 | 3.43% |
| 2000-4 | -0.42% 3 | -0.39% 4 | -2.75% 5 | 2.52% 1 | 1.06% 2 | 0.03% |
| 2004-4 | -0.98% 2 | -1.36% 3 | 0.50% 4 | -0.26% 5 | 0.37% 1 | -1.74% |
| Avg | -0.34% | -0.50% | 0.12% | 0.80% | 0.24% | 0.31% |
| SPX summary for Presidential Year 4 1928 - 2004 | ||||||
| Averages | -0.13% | -0.19% | -0.09% | 0.23% | 0.39% | 0.22% |
| % Winners | 50% | 25% | 50% | 55% | 65% | 50% |
| MDD 1/30/1932 5.05% -- 1/28/2000 3.53% -- 1/28/2004 2.33% | ||||||
| SPX summary for all years 1928 - 2007 | ||||||
| Averages | 0.13% | 0.02% | 0.16% | 0.29% | 0.15% | 0.73% |
| % Winners | 52% | 47% | 63% | 65% | 63% | 69% |
| MDD 2/1/1933 5.39% -- 1/30/1932 5.05% -- 2/1/1941 4.67% | ||||||
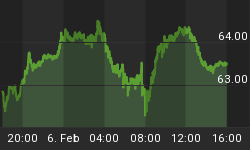
Money supply (M2)
This chart has been provided by Gordon Harms.

Conclusion
The persistence of high levels of downside volume suggest another down move is likely, however, it should be limited because new lows have all but disappeared.
I expect the major indices to be higher on Friday February 1 than they were on Friday January 25.
This report is free to anyone who wants it, so please tell your friends. They can sign up at: http://alphaim.net/signup.html. If it is not for you, reply with REMOVE in the subject line.
All of the major indices except the OTC were up last week so I am calling last weeks positive forecast a tie.


