


LET'S LOOK AT THE S&P FUTURES CHART - DAILY

The low was a classic big gap to new lows and recover to exhaust the short term move down. The day wasn't impressive since in didn't have huge volume and couldn't hold the gains. But the "FOLLOW THROUGH" the next day was very good and indicates a low of some magnitude. I was worried because the last move up was an 11day struggle and was weak. But the move down also started to struggle and became weak when each time it broke to new lows the index would immediately bounce back. The index has showed a wide range day that closed on the high and may need a day or two to consolidate that large move. But this rally should test the February high quickly by the 28th or there is something wrong with the move up.
The consensus numbers were as extreme as at the October 2002 low so there is evidence to expect a low along with this pattern of trending. The low came in on 150 calendar days from high, 90 to 99 days from high (a normal time period for a thrust down in a bear trend) and 45 calendar days and 135 points down from high. All indicating a possible low of some consequence. Now the big question is how far and for how long will it rally, minimum in time out to April 8th we'll discuss those probabilities next week.
NOW LET'S LOOK AT THE NASDAQ DAILY CHART

The struggling or creeping trend down is clear on the NASDAQ Composite daily chart. After the exhaustion low the index rallied 7 trading days and now 30 trading days later is just marginally below the exhaustion low. That time going down was obviously a struggle. The time period of 30 trading days relates to 45 calendar days and is a cycle or time period that can bring in a low. Struggling trends, as this as been, should be followed by fast moves almost vertical or there is something very wrong with the low. I've broke the range down into 1/8 and 1/3rd like we do with all markets as this gives the best look at support and resistance. It must get above the ¼ division of the range at 2330 or the downtrend trend will remain intact. The strongest resistance will be between 2420 and 2440 and should be hit by the 28th or worst case by April 9th or there is something wrong with the low.
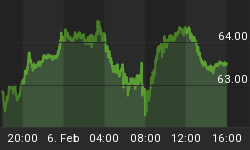
LET'S TAKE A QUICK LOOK AT THE FTSE DAILY CHART

I don't know why these should de-link from the US indexes but the picture is subtly different with a struggle up and fast trend down. It had a huge gap and weak close on the 17th and likely exhausted the short term move down. But it needs to rally more than 4 days or it may still have some downside left. If not then it should be back testing the February high. This bull campaign didn't even move up 100% in a 4+ years and gave up almost half that trend in this move down. This would not be my favorite bet for an index. It has been too weak moving up and too strong moving down.


