


The good news is:
• It is likely last Monday's low will mark the low point for the next several weeks.
Short Term
Last Monday there were 477 new lows on the NASDAQ, about the same as there were near the lows of last August, but substantially fewer than the 877 at the January low. Every day for the remainder of the week had less than half as many new lows as Monday.
The sharp decline in new lows suggests we are likely to have a rally that could last several weeks. Unfortunately, 477 is enough to suggest a high likelihood of a retest of last Monday's price lows.
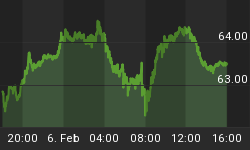
The chart below covers the past 9 months showing the NASDAQ composite (OTC) in blue and a 10% trend (19 day EMA) of NASDAQ new lows (OTC NL) in red. OTC NL has been plotted on an inverted Y axis so decreasing OTC NL moves the indicator upward (up is good). Dashed vertical lines have been drawn on the 1st trading day of each month. The dashed vertical line has been drawn in red on the 1st trading day of the year.

Intermediate Term
Volatility peaks near bear market lows.
In the past week we saw volatility hit its highest level in over 4 years.
The chart below covers the past 9 months showing the OTC in blue and indicator showing the mean of the absolute value of the daily percentage change of the OTC over the previous 10 trading days in black.
The indicator hit its high for the period on Friday with a value of 2.1% meaning the OTC has moved an average of 2.1% daily for the past 10 trading days.

For a historical perspective the following chart shows how the indicator behaved during the past 4 years. Dashed vertical lines have been drawn on the 1st trading day of each year.

The next chart shows the 2002 bear market low.
Volatility peaked at 3.4% near the low at the end of July and had a lower peak near the final bottom in October.

The highest volatility ever recorded was 5.6% at the beginning of 2001.
The chart below shows the period from October 2000 through March 2003. Dashed vertical lines have been drawn on the 1st trading day of each year.

Seasonality
Next week includes 5 of the last 6 trading days in March during the 4th year of the Presidential Cycle.
The tables show the daily change of the OTC and S&P 500 (SPX) for the last 6 trading days of March during the 4th year of the Presidential Cycle. OTC data covers the period from 1963 - 2004 and SPX data from 1928 - 2004. There are summaries for both the 4th year of the Presidential Cycle and all years combined.
Historically the period has been up a little more than half of the time, however, returns have been negative.
Report for the last 6 days of March
The number following the year represents its position in the presidential cycle.
The number following the daily return represents the day of the week;
1 = Monday, 2 = Tuesday etc.
| OTC Presidential Year Year 4 | |||||||
| Day6 | Day5 | Day4 | Day3 | Day2 | Day1 | Totals | |
| 1964-4 | -0.24% 1 | -0.13% 2 | -0.37% 3 | 0.27% 4 | 0.35% 1 | -0.27% 2 | -0.40% |
| 1968-4 | -0.40% 5 | 0.16% 1 | 0.50% 2 | 0.66% 3 | 1.18% 4 | 0.26% 5 | 2.36% |
| 1972-4 | 0.81% 4 | 0.13% 5 | 0.01% 1 | 0.13% 2 | -0.15% 3 | 0.48% 4 | 1.40% |
| 1976-4 | 0.63% 3 | -0.29% 4 | 0.24% 5 | -0.22% 1 | -0.22% 2 | 0.14% 3 | 0.29% |
| 1980-4 | -3.02% 1 | -1.55% 2 | -0.23% 3 | -6.15% 4 | 4.16% 5 | 1.35% 1 | -5.43% |
| 1984-4 | -0.32% 5 | -0.27% 1 | -0.08% 2 | 0.77% 3 | 0.25% 4 | -0.34% 5 | 0.01% |
| Avg | -0.46% | -0.36% | 0.09% | -0.96% | 1.04% | 0.38% | -0.28% |
| 1988-4 | -1.18% 4 | -0.81% 5 | -0.57% 1 | 0.69% 2 | -0.32% 3 | 0.77% 4 | -1.43% |
| 1992-4 | -0.51% 2 | 0.13% 3 | -0.66% 4 | -1.74% 5 | -0.43% 1 | 0.28% 2 | -2.93% |
| 1996-4 | 0.22% 5 | -1.37% 1 | 0.12% 2 | 0.51% 3 | 0.08% 4 | 0.60% 5 | 0.16% |
| 2000-4 | 0.45% 5 | -0.09% 1 | -2.51% 2 | -3.91% 3 | -4.02% 4 | 2.58% 5 | -7.51% |
| 2004-4 | 0.40% 3 | 3.02% 4 | -0.36% 5 | 1.66% 1 | 0.40% 2 | -0.32% 3 | 4.81% |
| Avg | -0.12% | 0.18% | -0.80% | -0.56% | -0.86% | 0.78% | -1.38% |
| OTC summary for Presidential Year 4 1964 - 2004 | |||||||
| Averages | -0.29% | -0.10% | -0.36% | -0.67% | 0.12% | 0.50% | -0.79% |
| % Winners | 45% | 36% | 36% | 64% | 55% | 73% | 55% |
| MDD 3/27/1980 10.60% -- 3/30/2000 10.18% -- 3/30/1992 3.18% | |||||||
| OTC summary for all years 1963 - 2007 | |||||||
| Averages | 0.01% | 0.06% | -0.04% | -0.14% | -0.03% | 0.12% | -0.03% |
| % Winners | 53% | 51% | 51% | 58% | 58% | 64% | 67% |
| MDD 3/27/1980 10.60% -- 3/30/2000 10.18% -- 3/29/2001 7.69% | |||||||
| SPX Presidential Year 4 | |||||||
| Day6 | Day5 | Day4 | Day3 | Day2 | Day1 | Totals | |
| 1928-4 | 1.38% 1 | -0.58% 2 | -0.26% 3 | 0.32% 4 | 1.74% 5 | -0.78% 6 | 1.82% |
| 1932-4 | -1.01% 4 | -3.05% 6 | -0.39% 1 | -0.13% 2 | 2.11% 3 | -5.56% 4 | -8.03% |
| 1936-4 | 0.87% 3 | -0.33% 4 | -1.53% 5 | 0.13% 6 | -0.20% 1 | 0.74% 2 | -0.32% |
| 1940-4 | -0.49% 1 | -0.50% 2 | 1.33% 3 | -0.25% 4 | 0.33% 5 | 0.57% 6 | 1.00% |
| 1944-4 | -0.16% 6 | -0.08% 1 | -0.99% 2 | -0.25% 3 | 0.67% 4 | -0.08% 5 | -0.90% |
| Avg | 0.12% | -0.91% | -0.37% | -0.04% | 0.93% | -1.02% | -1.29% |
| 1948-4 | -0.07% 3 | 0.41% 4 | -0.20% 6 | -0.14% 1 | 1.16% 2 | 1.41% 3 | 2.57% |
| 1952-4 | -0.59% 2 | -0.04% 3 | 0.88% 4 | 0.79% 5 | 0.66% 6 | 0.12% 1 | 1.83% |
| 1956-4 | 1.02% 4 | 0.23% 5 | -0.43% 1 | -0.76% 2 | 0.54% 3 | -0.06% 4 | 0.53% |
| 1960-4 | 0.43% 4 | 0.00% 5 | -0.21% 1 | -0.14% 2 | -0.22% 3 | -0.57% 4 | -0.72% |
| 1964-4 | 0.01% 1 | -0.18% 2 | 0.23% 3 | 0.28% 4 | -0.06% 1 | -0.20% 2 | 0.08% |
| Avg | 0.16% | 0.08% | 0.05% | 0.01% | 0.42% | 0.14% | 0.86% |
| 1968-4 | 0.10% 5 | -0.10% 1 | 0.68% 2 | 0.82% 3 | -0.10% 4 | 0.70% 5 | 2.10% |
| 1972-4 | 0.85% 4 | -0.21% 5 | -0.20% 1 | -0.12% 2 | -0.63% 3 | 0.67% 4 | 0.34% |
| 1976-4 | 1.15% 3 | -0.55% 4 | 0.00% 5 | -0.43% 1 | -0.39% 2 | 0.75% 3 | 0.53% |
| 1980-4 | -2.96% 1 | -0.09% 2 | -0.51% 3 | -0.47% 4 | 2.50% 5 | 1.40% 1 | -0.13% |
| 1984-4 | 0.11% 5 | -0.12% 1 | 0.40% 2 | 1.64% 3 | -0.23% 4 | -0.21% 5 | 1.59% |
| Avg | -0.15% | -0.22% | 0.07% | 0.29% | 0.23% | 0.66% | 0.89% |
| 1988-4 | -2.07% 4 | -1.84% 5 | -0.17% 1 | 0.78% 2 | -0.77% 3 | 0.32% 4 | -3.75% |
| 1992-4 | -0.25% 2 | -0.33% 3 | 0.08% 4 | -1.07% 5 | -0.12% 1 | 0.17% 2 | -1.52% |
| 1996-4 | 0.22% 5 | -0.09% 1 | 0.45% 2 | -0.62% 3 | 0.01% 4 | -0.53% 5 | -0.56% |
| 2000-4 | 0.01% 5 | -0.24% 1 | -1.06% 2 | 0.05% 3 | -1.37% 4 | 0.72% 5 | -1.89% |
| 2004-4 | -0.24% 3 | 1.64% 4 | -0.10% 5 | 1.30% 1 | 0.40% 2 | -0.07% 3 | 2.93% |
| Avg | -0.47% | -0.17% | -0.16% | 0.09% | -0.37% | 0.12% | -0.96% |
| SPX summary for Presidential Year 4 1928 - 2004 | |||||||
| Averages | -0.08% | -0.30% | -0.10% | 0.09% | 0.30% | -0.02% | -0.12% |
| % Winners | 55% | 15% | 35% | 45% | 50% | 55% | 55% |
| MDD 3/31/1932 7.93% -- 3/28/1988 4.03% -- 3/27/1980 4.00% | |||||||
| SPX summary for all years 1928 - 2007 | |||||||
| Averages | -0.14% | -0.10% | -0.03% | -0.04% | 0.00% | -0.17% | -0.47% |
| % Winners | 48% | 35% | 48% | 53% | 45% | 42% | 53% |
| MDD 3/31/1938 14.05% -- 3/31/1939 9.03% -- 3/31/1932 7.93% | |||||||
Conclusion
The high level of volatility and diminishing number of new lows suggests we saw a short term low last Monday.
I expect the major indices to be higher on Friday March 28 than they were on Friday March 21.
This report is free to anyone who wants it, so please tell your friends. They can sign up at: http://alphaim.net/signup.html. If it is not for you, reply with REMOVE in the subject line.
Last weeks negative forecast was a miss.


