


The following article was originally published at The Agile Trader on April 6, 2008.
Dear Speculators,
The Underlying theme that we've been pursuing in this space since December has been whether and to what extent policymakers can work to offset the negative effects of the credit market's woes on the broad economy and upon the stock market. But before we return to this subject explicitly, let's look at an important data point from Friday's employment report: the Employment-Population Ratio (EM Ratio).
As you can see the EM Ratio has dropped down from a high of 63.4% in December '06 to its most recent print of 62.6%. That's a a 0.8% decline.

Since the late '40s declines of the EM Ratio of more than 0.5% have all been associated with recessions (grey highlighted areas), as declared after the fact. That's a 10-for-10 track record in real time.
Could this time be different? Possible. It's always possible. But it's worth watching in the months ahead to see whether this EM Ratio continues to deteriorate down below the 62.4% level. Why? Because historically declines of more than 1% on the EM Ratio are associated more persistent periods of economic deterioration. So, if this ratio can cease its descent from a level less than 1% below its high, then the economic woes are likely to be less severe than if it keeps traveling south toward a level 2% or more below its '06 peak.
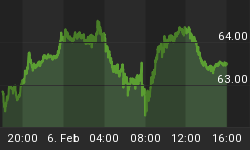
Now, let's look at something interesting from Friday. I'm not quite sure what it means, but it's of significant interest. On the weaker than expected employment numbers (80K net jobs lost in a population that's rising on average in excess of 200K, downward revisions to the past 2 months totaling in excess of 70K, an unemployment rate that rose by a whopping 30 basis points to 5.1%) the bond market rallied on a flight to quality.

The June 10-Yr Treasury Futures rallied almost a point, dropping the yield from 3.59% to 3.48%.
Why do I assume that that's a flight to quality? At least in part because the real yield on the 10-yr Treasury Inflation Protected Securities (TIPS), which is a rough proxy for the TIPS market's collective estimate of real economic growth during that period, dropped by 10 basis points from 1.28% to 1.18% on the day.
Meanwhile, the S&P June futures fell back after a pre-market rally, dropped down to the mid-1360s, and then rallied up and over 1380 before closing the day close to unchanged.

That's quite a different reaction in the stock market from that seen in the bond market.
Over the past year the positive correlation between the 10-yr Treasury yield and the SPX has been a very strong +0.84, so while it's not out of the question for the stock and bond markets to move out of sync with one another, there is a strong probability that they'll have to resolve this dispute (the bond market became more pessimistic about the economy while the stock market did not) sooner than later.
Unfortunately the record is a bit mixed on which way this kind of dispute gets resolved the next day. However, since mid-1999, when the SPX has closed higher on a day on which the 10-yr Treasury Note has fallen by 10 basis points or more, the SPX has tended to move lower over the ensuing 2 trading days. There have been 25 such days since August '99 and the sum of the SPX performance during the 2 days following this kind of "dispute" has been a net of 25% in losses for the index.
Does that mean that the SPX has to fall over the next 2 days? Of course not. But it does suggest that, in recent history, when the bond market surges on a flight to quality (dropping bond yields) and stocks ignore the warning, the short-term resolution has tended to favor the bond market's assessment of the situation.
With these short-term considerations under our belt, let's look at some of the broader picture. This past week saw a marked improvement in the pricing of the ABX Index, which tracks the mark-to-market price of a recently issued tranche of mortgage-backed bonds.

When the ABX Index broke below 65, I noted that there was a technical target in the 52-53 area. That target was achieved, and we now have a technical bounce that looks poised to rally the index back up perhaps as high as 64-65 again.
A rally as described would likely be cause for optimism among bankers and analysts alike, as it would take some of the pressure off the capital and collateral requirements for the institutions holding these bonds. Failure of the ABX Index at or below the 64-65 area would probably begin to put the pressure on these folks again, and be cause for further consternation in the financial markets. However a break above 65 could induce some real euphoria especially insofar as it might begin to bring out of the woodwork media pundits calling for the end of the credit crunch.
This improvement on the ABX Index may well be at least in part a function of the aggressive action taken by the Fed and the Treasury Department, among others, as well as of the collaborative testimony offered by officials from both offices to the Senate last week. Additionally, we are seeing extremely strong growth in both Money of Zero Maturity (MZM), the Fed's narrowest measure of money supply, as well as in M2, the Fed's broadest measure of money supply.
This next chart plots the 13-wk annualized growth rate of M2 along with the SPX.

The spike in M2 growth that we're seeing now, up and over 15%, is the sharpest spike we've seen since 9/11, and is rivaled in recent memory only by the spikes in October '98, in the spring of '01, in August '03, and in May '04.
While this data comes out with a 2-week lag and is subject to revision, it's clear that we have a significant spike in M2 growth, and that these kinds of spikes are associated with concerted action from the Fed to address a major economic or market problem. It is further clear that, more often than note, when M2 spikes like this, the market tends to respond quite positively over a period of weeks.
On the earnings front, trailing operating earnings for the SPX (yellow line on the chart below) have stabilized over the past several weeks as we head into the teeth of the reporting season for 1Q08. However, the consensus forward estimate for earnings has continued to decline.

(We are currently using the consensus top-down estimates for 1Q09 and 2Q09 in our time-weighted calculation. The bottom-up estimates should be out within the next few weeks, so there may be revisions to the blue line above.)
Reported earnings (pink line) continue to deteriorate precipitously, as write-downs, mark-downs, and "one-off" events are dumped into the landfill along with the kitchen sink.
The Fed's reaction function continues to look pretty aggressive relative to their past policy accommodations. This next chart shows the Y/Y change in the Fed Funds rate (red line) plotted against the Y/Y change in the consensus forward earnings estimate (blue line).

The red lin continues to lead the blue line lower, suggesting that the Fed is out in front of the deterioration in estimates, as they were in '96, but as they were NOT in '98 or in '00-'01.
That said, numerous members of the Fed have spoken about the need to be preemptive in raising rates again, should the economy begin to recover and should there be a flair-up in inflation. So, if/when earnings begin to recover (when the blue line stops declining and reverses its course, rising above 0%), the Fed is unlikely to leave the red line lagging behind the rise in the blue line, as they did in the '03-'04 period. And that could tighten monetary conditions more quickly than has been the case during the early stage of other recent economy recoveries.
Despite the economy's current woes and the credit market's specific problems, conditions are becoming more and more conducive to a cyclical rally during the next 2-2.5 years.
The yield curve (which we here define as the difference between the 10-Yr Treasury yield and the Fed Funds rate) has risen up to 1.29%.

A rising yield curve tends to be conducive to expanding PE ratios. Why? At least in part because a tighter or inverted yield curve expresses a relatively tight (non-accommodative) Fed, and a steeper yield curve suggests that on a relative basis the Fed is willing to be more accommodative.
As you can see on this chart, there's still plenty of room for the yield curve to steepen more—it was up over 3% as recently as '04.
Moreover, Equity Risk Premium (the spread between the SPX's forward earnings yield and the 10-yr Treasury yield, and which represents the excess yield demanded by investors in order to assume the risk of investing in stocks) remains at an elevated level of 3.45%. That's down from the 4%+ ERP of early/mid March, but is still very high.

While ERP is not an effective short-term timing market-timing tool, historically the stock market has tended to perform quite strongly in the 2-2.5 years following very high risk premium levels, and much less strongly (or weakly) following periods of depressed ERP. As we are now in a period of extremely elevated ERP, the odds favor the market being quite a bit higher in a couple of years than it is now.
Best regards and good trading!


