


4/15/2008 7:13:54 AM
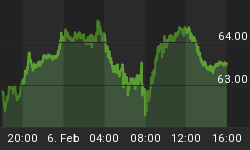
So far, the Qs are just filling the gap from 4/1. What's our price projection?
Welcome to the Daily stock barometer. This article comes out every day and gives our specific trading advice for the Nasdaq-100. If you're interested in following our signals and learning more about our system, then I invite you to click here and subscribe - since the market can turn on a dime and so too can our interpretation as the market gives its daily clues to the future. Or sign up for our free weekly newsletter, where we provide up to date articles from our various traders.
We also offer a free weekly indicator chart if you visit our home page and scroll to the bottom. This chart will be updated each week, so be sure to check back frequently for updates. www.stockbarometer.com - don't forget to scroll to the bottom.

Stock Barometer Analysis
The barometer remains in Sell Mode.
The Stock Barometer is my proprietary market timing system. The direction, slope and level of the Stock Barometer determine our outlook. For example, if the barometer line is moving down, we are in Sell Mode. A Buy or Sell Signal is triggered when the indicator clearly changes direction.
Stock Barometer Cycle Time
Today is day 4 in our down cycle.
The Stock Barometer signals follow 5, 8, 13, 21 and sometimes 34 day Fibonacci cycles that balance with 'normal' market cycles. Knowing where you are in the current market cycle is important in deciding how long you expect to maintain a position.
Potential Cycle Reversal Dates
2008 Potential Reversal Dates: 12/31, 1/11, 2/1, 2/13, 3/6, 4/5, 4/22, 5/23, 6/6. We publish these dates up to 2 months in advance.
If all goes as planned, we're looking for a move lower into 4/22.
My Additional timing work is based on numerous cycles and has resulted in the above potential reversal dates. These are not to be confused with the barometer signals or cycle times. However, due to their past accuracy I post the dates here.
2007 Potential Reversal Dates: 1/10, 1/14, 1/27, 1/31, 2/3, 2/17, 3/10, 3/24, 4/21, 5/6, 6/15, 8/29, 10/19, 11/29, 12/13, 12/23, 12/31, 1/11/08. 2006 potential reversal dates: 1/16, 1/30, 2/25, 3/19, 4/8, 5/8, 5/19, 6/6(20), 7/24, 8/20, 8/29, 9/15, 10/11, 11/28. 2005 Potential reversal dates based on 'other' cycle work were 12/27, 1/25, 2/16, 3/4, 3/14, 3/29, 4/5, 4/19, 5/2, 6/3, 6/10, 7/13, 7/28, 8/12, 8/30-31, 9/22, 10/4, 11/15, 11/20, 12/16.
The following work is based on my spread/momentum indicators for the QQQQ, GLD, USD, USO and TLT. They are tuned to deliver signals in line with the Stock Barometer and we use them only in determining our overall outlook for the market and for pinpointing market reversals. The level, direction, and position to the zero line are keys in these indicators. For example, direction determines mode and a buy signal 'above zero' is more bullish than a buy signal 'below zero'.
QQQQ Spread Indicator (NASDAQ:QQQQ)

The QQQQ Spread Indicator will yield its own buy and sell signals that may be different from the Stock Barometer. It's meant to give us an idea of the next turn in the market.
Gold Spread Indicator (AMEX:GLD)

To trade Gold, utilize the Gold ETF AMEX:GLD. This gives us a general gage to the overall health of the US Economy and the markets, as well as to assists us in the entry of positions in our stock trading service.
US Dollar Index Spread Indicator (INDEX:DXY)

To trade the US Dollar, I'd utilize the Power Shares AMEX:UUP: US Dollar Index Bullish Fund and AMEX:UDN: US Dollar Index Bearish Fund.
Bonds Spread Indicator (AMEX:TLT)

To trade Bonds, I recommend Lehman's 20 year ETF AMEX:TLT. Note that the direction of bonds can have an impact on the stock market. Normally, as bonds go down, stocks will go up and as bonds go up, stocks will go down.
OIL Spread Indicator (AMEX:USO)

To trade OIL, utilize AMEX:USO, the OIL ETF. We look at the price of oil as its level and direction can have an impact on the stock market.
Supporting Secondary Indicator

I monitor over a hundred technical indicators, some that are widely followed and some that are proprietary. These indicators break down the market internals, sentiment and money flow and give us unique insight into the market. I feature at least one here each day in support of our current outlook - and to give you an education on what professional traders utilize.
Summary of Daily Outlook
We remain in Sell Mode, looking for the market to move lower into 4/22.
4/22 is critical to our call. There is some bullish energy building up in the short term and if we get a move lower into 4/22, then we should be set up for a larger move higher. However, if the market reverses here and moves higher into 4/22, then it's another leg lower into the 9 month cycle low date (chart above).
Price projections? I never do price projections. If you notice, I am all about timing. Get the timing right and the price doesn't matter. Setting expectations on price movement will only serve to create a bias in your trading that is difficult to overcome. Eliminate as much bias as possible in your trading.
Welcome to the Daily stock barometer. This article comes out every day and gives our specific trading advice for the Nasdaq-100. If you're interested in following our signals and learning more about our system, then I invite you to click here and subscribe - since the market can turn on a dime and so too can our interpretation as the market gives its daily clues to the future. Or sign up for our free weekly newsletter, where we provide up to date articles from our various traders.
We also offer a free weekly indicator chart if you visit our home page and scroll to the bottom. This chart will be updated each week, so be sure to check back frequently for updates. www.stockbarometer.com - don't forget to scroll to the bottom.

If you have any questions or comments, email me at Jay@stockbarometer.com.
Regards,


