 |
Gold •584 days | 2,368.70 | +35.30 | +1.51% |
 |
Platinum •15 mins | 2,099.40 | +28.80 | +1.39% |
 |
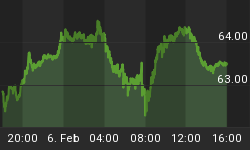
WTI Crude •1 day | 63.55 | +0.26 | +0.41% |
 |
Gasoline •1 day | 1.953 | +0.027 | +1.38% |
 |
Ethanol •584 days | 2.161 | +0.000 | +0.00% |
 |
Silver •584 days | 30.82 | +1.16 | +3.92% |
 |
Silver • 584 days | 30.82 | +1.16 | +3.92% | |
 |
Copper • 584 days | 4.530 | +0.111 | +2.51% | |
 |
Brent Crude • 1 day | 68.05 | +0.50 | +0.74% | |
 |
Natural Gas • 1 day | 3.422 | -0.087 | -2.48% | |
 |
Heating Oil • 1 day | 2.413 | +0.020 | +0.84% |

Marty Chenard
Contributor since: 26 Feb 2010
Biography
Marty Chenard is an Advanced Stock Market Technical Analyst that has developed his own proprietary analytical tools and stock market models. As a result, he was out of the market two weeks before the 1987 Crash in the most recent Bear Market he faxed his Members in March 2000 telling them all to SELL. He is an advanced technical analyst and not an investment advisor, nor a securities broker.
-
Option's Timing Indicator
The Option's Timing Indicator showed trend lines that were down trending while in positive territory. The thick red line showed a down tick that was…
-
Option's Timing Indicator
The Option's Timing Indicator showed trend lines that were neutral while in positive territory after more convergence. The thick red line showed a down tick…
-
Option's Timing Indicator
The Option's Timing Indicator showed trend lines that were up trending while in positive territory with less Acceleration and with short term softness that came…
-
Option's Timing Indicator
The Option's Timing Indicator showed trend lines that technically changed to up trending after seeing more divergence on its trend lines. The thick red line…
-
Option's Timing Indicator
The Option's Timing Indicator showed trend lines that were technically down trending, with the thick red line showing a small up tick while above the…
-
Option's Timing Indicator
The Option's Timing Indicator showed trend lines that were technically down trending now after converging, with the thick red line showing a down tick while…
-
Option's Timing Indicator
The Option's Timing Indicator showed trend lines that were technically up trending and mixed with the thick red line showing a down tick while below…
-
Option's Timing Indicator
The Option's Timing Indicator showed trend lines that were down trending with the thick red line negative and below the red trend line and below …
-
Option's Timing Indicator
The Option's Timing Indicator showed trend lines that were technically moving down with upside convergence. The thick red line had a positive up tick that…
-
Option's Timing Indicator
The Option's Timing Indicator showed trend lines trending up but showing MERGED trend lines for a test today. The thick red line had an up…
-
Options Timing Indicator
The Option's Timing Indicator showed down moving trend lines with convergence and the thick red line was positive and above both the red and blue…
-
Option's Timing Indicator
Trying to improve but more work is needed ... The Option's Timing Indicator showed down moving trend lines that were merged for a test today.…
-
Food for Thought ...
Can the stock market really outdo the Banking Index ($BKX)? Below is a chart of the Banking Index. Short term, you can see that the…
-
VIX
This morning around 3:15 AM, the VIX futures gapped up. (Do remember that the VIX moves opposite to the stock market.) The VIX was up…
-
VIX
The VIX is facing a challenge right now ... a close above 11.32 would be a negative for Tuesday. On Friday, the VIX closed at 10.58…
-
Inflowing Liquidity Levels
The United Kingdom's Prime Minister (Theresa May) opted for a hard Brexit last week, and President Trump is seeing resistance. The backdrop for economic health…
-
Holding ... But Susceptible
Holding ... but susceptible. That describes the market now as we await a challenging week and a speech (today) by Prime Minister Theresa May where…
-
Challenged but Not Dead Last Friday ...
The Institutional Selling trend lines had a small up tick but still showed that it has been trending lower. Note that less selling is a…
-
An Institutional Buy/Sell Overview ...
Institutional Selling trend lines showed that it has been trending lower. (Note that less selling is a positive and more selling is a negative.) The…
-
An Institutional Buy/Sell Overview ...
The chart for Institutional Buying and Selling activity for last Friday's close is now posted. When you look at it, it looks like a good…


