"No warning can save people determined to grow suddenly rich" - Lord Overstone
 |
Gold •584 days | 2,368.70 | +35.30 | +1.51% |
|
Platinum •10 mins | 2,099.40 | +28.80 | +1.39% |
|
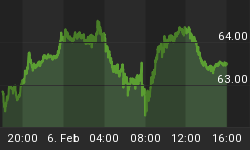
WTI Crude •23 hours | 63.55 | +0.26 | +0.41% |
|
Gasoline •23 hours | 1.953 | +0.027 | +1.38% |
|
Ethanol •584 days | 2.161 | +0.000 | +0.00% |
|
Silver •584 days | 30.82 | +1.16 | +3.92% |
 |
Silver • 584 days | 30.82 | +1.16 | +3.92% | |
|
Copper • 584 days | 4.530 | +0.111 | +2.51% | |
|
Brent Crude • 22 hours | 68.05 | +0.50 | +0.74% | |
|
Natural Gas • 23 hours | 3.422 | -0.087 | -2.48% | |
|
Heating Oil • 23 hours | 2.413 | +0.020 | +0.84% |
Joseph VanDerveer

Contributor since: 06 Jun 2016
Biography
Joseph VanDerveer is the Chief Technical Analyst with 8 years experience in the trenches trading the markets with a brand new website and service
-
SPY
Obviously this is a projection and may not come to pass. Take a look at the beautiful symmetry with time and price. If SPY does…
-
Short Opportunity
Nasdaq Weekly Chart with Fib. Spiral @ Week 34 Many traders are frustrated with the current market, sideways to slow melt up process. I will…
-
Cup With Handle
Nasdaq Composite I expect we will have new highs in Dow Jones, S&P 500, and the Nasdaq by next week. This is actually a better…
-
Facebook Trade Set-Up
Facebook Crushed Earnings Overall Facebook is a strong company with great numbers. Including 59% YoY revenue growth, 16 quarters beating earnings estimates, and 2 billion…
-
Rally IS Over
VIX verse OEX Many fund managers and analysts are calling for much higher prices in the market near term, medium term, and long term, extremely…
-
Market Topping Internals, Buy This Rally and See What Happens!
Market Internals Everyone is Bullish, perfect time to short with stops in place of course. Below is a simple chart of one way to look…
-
VIX Strategy, Maximum Profits $
Proshares UVXY 2x ETF Everyone wants to find ways to maximize profits and minimize losses. That's part of the game in trading the market. I…
-
QQQ's Strategy
Swing Trading the QQQ's My strategy is to time the market using the QQQ's which is an exchange-traded fund based on the Nasdaq-100. Powershares QQQ's…
-
NYSE Megaphone Top and Brexit
The market has been strong and holding up even in the face of "Brexit" the British referendum which resulted in the majority deciding to vote…
-
SPY Bull Gift
Updated chart of Spy. No mini crash on 6/29-6/30. Looking for standard deviation and vix to calm down a bit with higher prices from here.…
-
Spy Kiss of Death?
Everyone wants to now what that market is going to do next. Most technicians I talk to are Bullish and that makes me nervous. But…
-
Weekly NDX Chart
Here is a basic chart of Nasdaq-100 ticket symbol NDX showing a few different techniques used. This shows about 5% of what I use in…
-
DAX HS Break Leading?
Simple daily chart for the last year on the The German Stock Index "DAX" which comprises 30 German blue chip stocks. Notice the price fib.…
-
NYA/TLT 2y, Weekly Chart and Analysis
Bearish View Chart below shows a comparison of up-trending TLT and down-trending NYA. I would like to point out the two TLT spikes and lows…
-
Nasdaq Composite - Pieces of The Puzzle
Below is a weekly chart of the Nasdaq or Comp accompanied by 5 pieces of the market puzzle. Williams %R oscillator is suggesting overbought conditions.…
-
TLT and SPY Inverse Correlation
Here is an interesting chart below showing TLT which is iSHARES 20 year plus Treasury Bonds exchange-traded fund. The red arrows and comments represent major…
-
Spy Decision Emminent!
Below is a Daily Chart of SPY. I would like to point out a few observations, starting with the two rising wedges that take a…
Sign up to the
Safehaven Market Insider


