Well ... is there such a thing? An index that the others follow? An index that can't be manipulated because it "really isn't a trade-able index"? And yet, an index that is a great technical analysis reflection of the stock market?
The answer is yes. The index is a compilation of the "core holdings" being held by Institutional Investors. The core holdings aspect means that the index is made up of a list of the holdings that represents the majority of their financial commitments. And, since Institutional Investors account for most of the program trading ... and market volume each day, then this becomes an important way to tract what is really happening in the markets.
It has been my experience that the "core holdings" index of Institutional Investor stocks has much better technical analysis accuracy. For instance, when the Bull Market peaked, on October 11th. 2007, the Institutional "core holdings" index hit an EXACT 61.8% Fibonacci retracement while the other indexes did not. That day marked the EXACT top of the market.
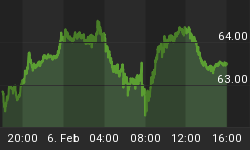
And lately, our 60 minute Institutional Index chart has been showing exactly what pattern the market is following when it wasn't as clear on the other indexes. (See the chart below.)
For Instance, last October/November, we pointed out an inverted Head & Shoulder pattern as seen in circle #1. The index went up, exactly to the Head & Shoulders projection.
After that, a new pattern emerged with the projection level becoming the center pivot for the pattern. The pattern since November has been an "Expanding Wedge" pattern.
Note how the Index moves up to the resistance and then moves down to the support.
Investors find such a pattern to be an insidious whip-sawing event because the market makes a higher/high and then a lower/low. By doing so, no trend is in place that meets the definition of a trend.
So what is this chart showing now? It is showing a bottom wedge support hit last Friday. The bottom of the wedge is where the market stopped its descent last Friday.
Now, this wedge is 3 months old which is getting kind of mature in time for a pattern. At some point in the near future, this pattern should end and evolve into a new market pattern. (Institutional Index charts are posted and updated every morning on our paid subscriber sites.)


